Snapshot
Financial conditions have eased considerably since late October 2023. The US Federal Reserve (Fed) had often pushed back against leaning towards premature bouts of easing over the past two years. However, it chose not to at the December Federal Open Market Committee (FOMC) meeting, essentially agreeing with the markets that inflation was on course to get back to target. Undoubtedly, US inflation has fallen back at a healthy pace, allowing for the Fed’s shift to a (semi) dovish tone and a more encouraging growth outlook.
The markets rightly responded very positively. However, the fast re-pricing by the markets, with rate cuts expected as early as March followed by more, looks ambitious in the face of still-decent economic data and potentially improving growth on the back of easing financial conditions. In this respect, we expect the rates market to remain on a volatile roller-coaster ride, albeit without the angst seen in late October 2023 as a US 10-year yield of 5% looks a reasonably firm cap on the extent of any resumed selloff.
Meanwhile, the US economy continues to look robust, so we have stayed constructive on growth assets and short maturity global credit where yields are attractive. We still believe that the path to 2% inflation in the US is relatively unclear. If anything, our conviction on this point has increased because easier financial conditions may ultimately pave the way for the return of sticky inflation. The key signpost may be energy prices, which is the most important driver of inflation; so far, though, prices are stable at relatively low levels. In our view, commodity-linked assets remain a decent hedge when the trajectory of inflation remains more unclear relative to what the markets are currently expecting.
Cross-asset1
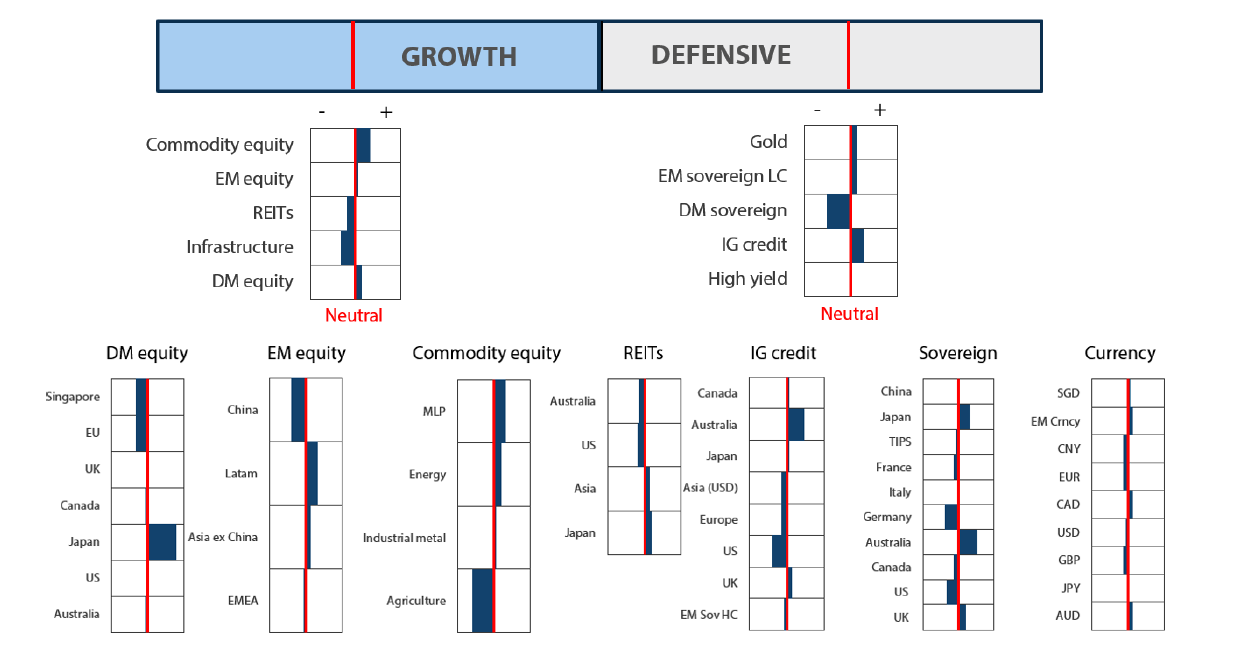
We reduced our defensive assets score to neutral and maintained our neutral score for growth assets. The final FOMC meeting of 2023 delivered a mild surprise as members dropped their hawkish tone and highlighted definitive progress in the central bank’s fight against inflation, despite financial conditions having eased considerably over the last few months.
The US economy remains reasonably strong, not yet showing any convincing weakness in either the labour market or consumer demand. Nevertheless, inflation is coming down and the Fed is apparently satisfied that the trajectory is certain enough to project rate cuts for later in 2024. This is an important change in tone and undoubtedly both growth and defensive assets responded with strong gains to end 2023. We welcome the change in message in terms of support for asset prices However, we are more concerned about still-remaining inflationary pressures challenging the current assumption that inflation will naturally decline to the Fed’s target levels and allow substantial monetary policy easing in 2024.
We left our growth scores unchanged, believing that we have the right balance of inflation-hedging commodity-linked equities and a mix of secular growth and cyclical opportunities funded by an underweight to interest rate-sensitive REITs and infrastructure. As yield curves become too aggressively priced for substantial rate cuts in 2024, we took residual inflation risks into consideration and reduced our sovereign bonds within defensives assets. These reductions were used to boost exposures to investment grade (IG) and high yield credit where yields are more sensible at the shorter end of inverted yield curves and economies remain supportive of credit quality.
Asset Class Hierarchy (Team View2)
Research views
Growth assets
Investors are sometimes dismissive of Emerging Markets (EM) simply because exceptionally poor performance by China has been such a drag to the broad benchmark. China’s growth prospects are important when assessing the outlook for EM, but in our view the pressure on China equities has less to do with disappointing demand than stagnant earnings growth prospects. To be sure, China’s growth has been disappointing, mainly for stingy stimulus and depressed sentiment that never recovered from protracted lockdowns in 2022 and the ongoing struggle of the property market. However, China demand does not qualify as depressed while other demand drivers have emerged around the world, such as a generous US fiscal impulse and structural shifts in demand driven by themes like friend-shoring. We see attractive opportunities in EM, but it pays to be very selective.
Diverging opportunities in EM
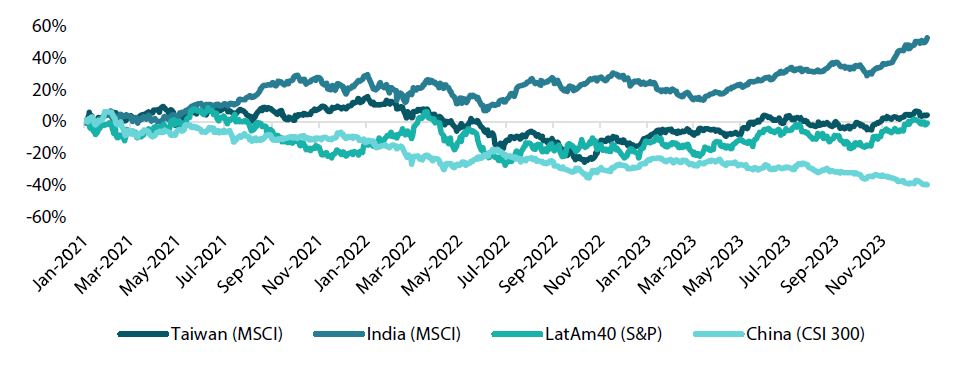
Equity markets follow growth over the long term, and nowhere has performance diverged more extremely than between India (up 53% over three years) and China (down 40%). India’s stronger economic recovery is core to its equity performance lead, but the country has structurally and persistently always been a world leader in terms of profitability. In the broadest terms, India tends to squeeze the most out of capital, while China tends to misallocate it. This is not universally the case, but the generalisation is accurate enough to describe the divergence in performance that has extended over several decades. India also benefits from new sources of growth that include being the beneficiary of shifting supply chains often at the expense of China. India is building production capacity to serve new sources of demand, while China is trying to find new sources of demand to utilise its excess capacity.
Elsewhere in EM, growth prospects and market performance are more nuanced. For example, performances by Taiwan and Latin America (LatAm) have essentially been flat over the last three years, each driven by different growth dynamics (Chart 1). Taiwan equities are still principally driven by the technology (tech)-hardware cycle (semiconductors and memory), while LatAm tends to follow sentiment linked to commodities that the region exports as well as domestic macro and political dynamics.
Chart 1: 3-year cumulative performances highlight extreme divergence
Source: Bloomberg, January 2024
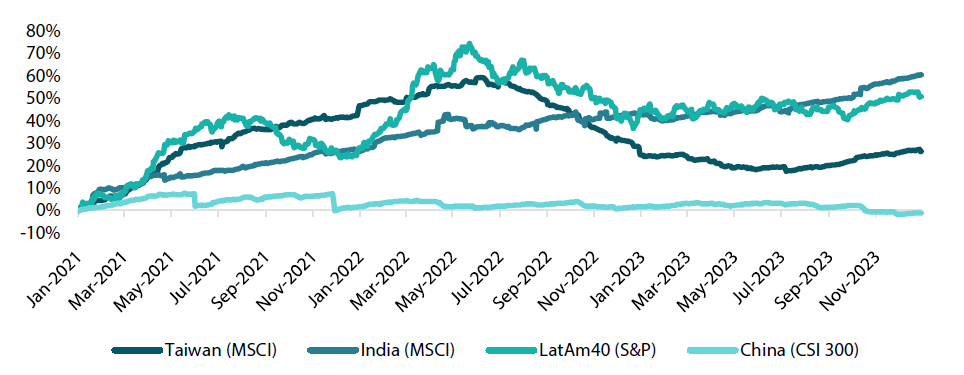
Earnings expectations help us to understand the divergence in India and China performance as well as some of the associated drivers behind Taiwan and LatAm. Not surprisingly, as shown in Chart 2, India has shown not only the strongest earnings growth but also low volatility. India's earnings expectations have risen more than 60% over the three-year period, which is on par with its market performance (+55%), with ample opportunity for further upside. On the other hand, China’s earnings have treaded water over the period, which begs the question of where China can find growth.
Taiwan’s earnings expectations were up by 60% by the summer of 2022, driven by stimulus-fuelled, outsized demand coupled with pricing power propelled by supply chain disruptions. However, as these drivers unwound, tailwinds turned to headwinds, exacerbated by a significant inventory glut. Today, inventories have normalised, and the cycle has started anew—this time finding new demand support in the form of high-performance computing that underlies heavy investment in artificial intelligence (AI). Earnings are picking up, and we expect this dynamic to continue.
Earnings expectations for LatAm have generally followed the commodity market, and while they are still weaker than the peak, (having peaked at around +70% mid-2022), they are up about 50% over three years and look to be gaining positive momentum. Our take is that earnings prospects should improve as we see continued support for commodity prices; more importantly, earnings could find support from US demand, friend-shoring and rate cut-driven domestic demand.
Chart 2: 3-year cumulative earnings growth (forward 12-month estimates)
Source: Bloomberg, January 2024
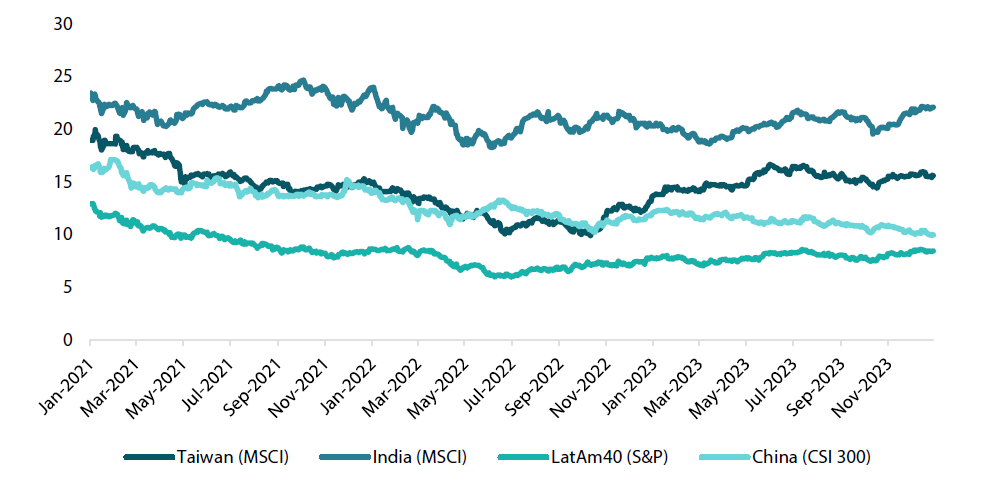
Valuations look reasonable across the board. India’s 22x forward price-to-earnings multiple (fPE) is on the expensive side, but earnings have consistently delivered and growth prospects remain strong (Chart 3). LatAm looks cheap at 8.4x fPE, particularly given its improving fundamentals, so we see price support and perhaps room for re-rating higher as growth improves. Earnings multiples are less helpful for evaluating Taiwan because price forecasts are focused on the tech-hardware cycle—an area in which analysts’ estimates tend to lag. China is cheap and getting cheaper—just under 10x fPE—but until there is a clearer path to better growth, China equities may remain lacklustre.
Chart 3: 3-year forward price-to-earnings (12-month earnings estimates)
Source: Bloomberg, January 2024
Overall, we remain constructive on EM but remain very selective about where we see the best prospects. China is no longer the most important driver of EM growth prospects, and each market has unique drivers of risk and reward driven by a fast-changing macro and geopolitical landscape. We expect divergences to continue, and therefore it remains sensible to consider each market and sector for its unique characteristics relative to the new landscape and potentially a new world order.
Conviction views on growth assets
- Japan equities are the top pick: Reforms are leading to the fast restructuring of balance sheets. This will improve profitability in the years ahead, while Japan also benefits from being a key Western ally, seeing strong investment that has been diverted away from China.
- US secular growth: The US remains the centre of tech and secular growth opportunities, the latest manifestation coming in the form of AI. We expect strong investment to continue, but we also expect AI to deliver significant gains in productivity that the world desperately needs against tight labour.
- Commodity-linked equities: Central banks are finished raising interest rates and rate cuts are coming with no recession in sight. While commodities had seen headwinds in the form of recession worries, we see this asset class as the best hedge to stickier inflation and perhaps the ongoing uncertainty in rates.
Defensive assets
We downgraded our view on sovereign bonds again in December, moving the asset class to a relatively large underweight within our defensive asset classes. As December saw the bond rally continue on the back of expectations that the Fed would soon begin cutting rates, bond curves have again moved to relatively large levels of inversion compared to the cash rate. While we have some sympathy towards views that central banks globally will begin cutting rates in 2024 as inflation moderates, the size and pace of the expected cuts looks somewhat aggressive compared to the flow of economic information that suggests a soft landing globally is becoming more likely. The inversion of the bond curve makes income and carry particularly hard to achieve in sovereigns, and therefore we look to reduce our exposure and move into areas that can generate better yield opportunities.
On the back of this, we have again upgraded our view on IG credit, moving the asset class to be more overweight. Within IG credit, decent levels of spread can be generated across markets such as Australia, the UK and Canada, which creates better yield opportunities than holding long-dated sovereign bonds. Additionally, the US has continued to show that growth is performing nicely, with unemployment remaining below 4% and no signs yet that inflation will reach the Fed’s 2% target. In an environment where sovereign bonds are expensive and economic growth continues to be positive, we expect IG spreads to perform well.
Inflation: will the last 1% be sticky?
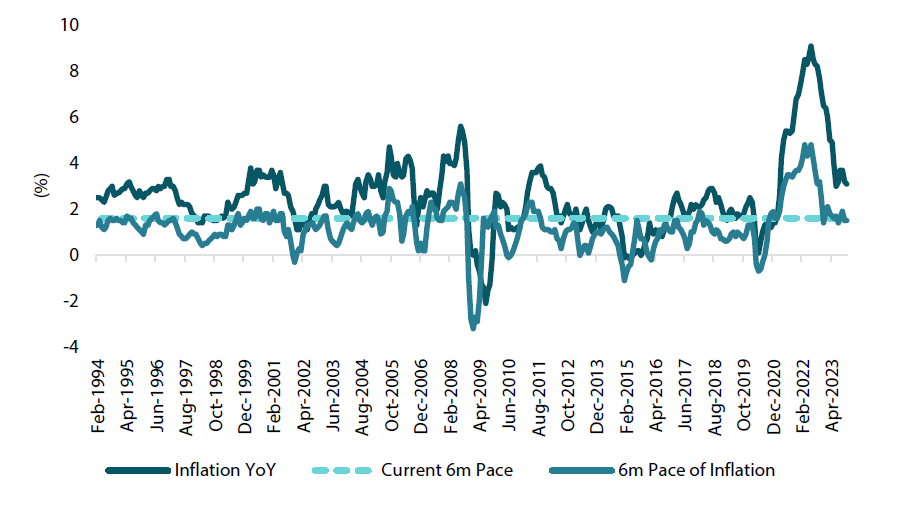
Financial markets have entered a strong risk-on phase over the past two months, driven by the expectations that the Fed will soon be cutting rates. These market expectations have coincided with US inflation falling from their lofty mid-single digit levels back towards a 3% range. This would not be low enough for most central banks’ targets, but it is still a step in the right direction and enough for the markets to expect that restrictive rates are no longer warranted. While it is indeed true that inflation does appear to be now at more manageable levels, there are some questions remaining whether the Fed will be able to push inflation back to 2%. Demonstrating this is the current six-month pace of inflation (shown in Chart 4), which was still running at +1.6% for the last six months of 2023. This pace of inflation is not consistent with hitting a 2% target, as any levels of inflation over the next six months will create a headline figure above 2%. This likely means that the Fed will be required to run a contractionary policy at least through the first two quarters of 2024.
Chart 4: US monthly inflation—YoY and 6-month pace
Source: Bloomberg, January 2024
Potentially similar situations to the current environment were seen in the late 1990s and mid 2000s when inflation sat in a 2–4% range, consistently above the Fed’s 2% target. To tame inflation during these periods, the Fed maintained a real rate (cash rate minus inflation rate) of 2-4%, only using negative real rates following the Global Financial Crisis to breathe life back into the economy. Using this information, if inflation remains consistently above the 2.5% level, we could expect the Fed to determine that contractionary policy requires holding the cash rate 2% above the inflation rate, maintaining that level until inflation is deemed back under control. Under these circumstances, an expected cash rate in the US would land around 4.5%, not dissimilar to what the Fed is forecasting for 2024 in their dot plots.
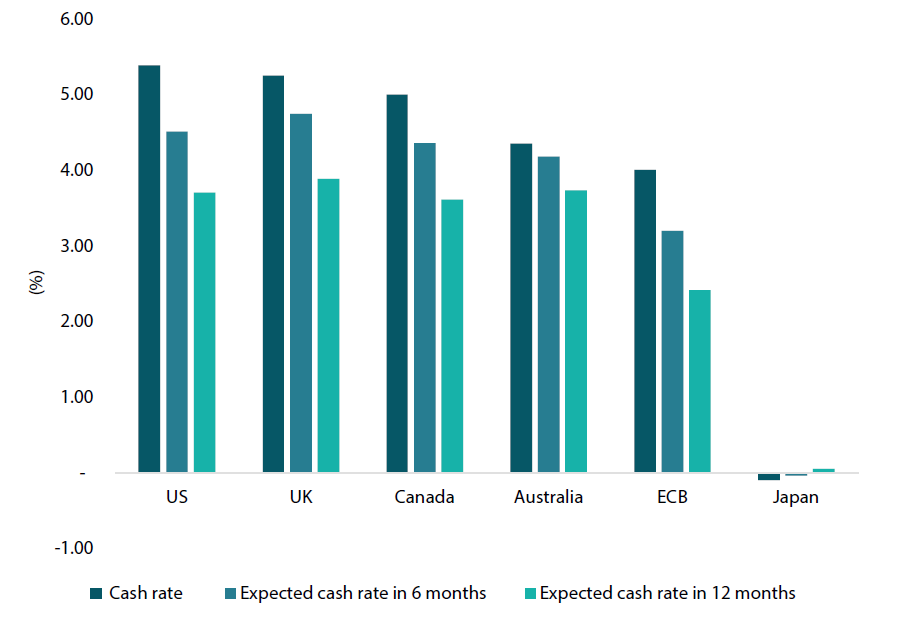
Despite this, the markets are far more bullish on the notion of rate cuts and reducing the real rate from its lofty levels. Chart 5 below shows the key central bank cash rate expectations for the next 12 months, with the markets expecting all countries to have cash rates below 4% during the course of 2024. This implies that real rates need to contract and move into a potentially neutral policy stance through the end of 2024. In line with these expectations, long bond yields have fallen considerably, inverting the bond curves in anticipation of the cuts to occur. This rally is what has driven our recent reductions to sovereign bonds, as while the inflation data has softened, global growth appears to be robust and unemployment rates remain at extremely low levels, meaning we do not yet foresee that the removal of the contractionary policy stance is required.
Chart 5: Cash rate expectations
Source: Bloomberg, January 2024
Conviction views on defensive assets
- Short-dated IG credit: Credit spreads remain at fair levels but inverse yield curves in many markets make longer-dated credit less attractive, leaving shorter-dated credit as our preference.
- Gold is still an attractive hedge: Gold has been resilient in the face of rising real yields and a strong dollar while proving to be an effective hedge against geopolitical risks and sticky inflation pressures.
- Attractive yields in EM: Real yields in this sector are generally very attractive and we prefer quality EM currencies against the backdrop of a generally weaker dollar.
Process
In-house research to understand the key drivers of return:
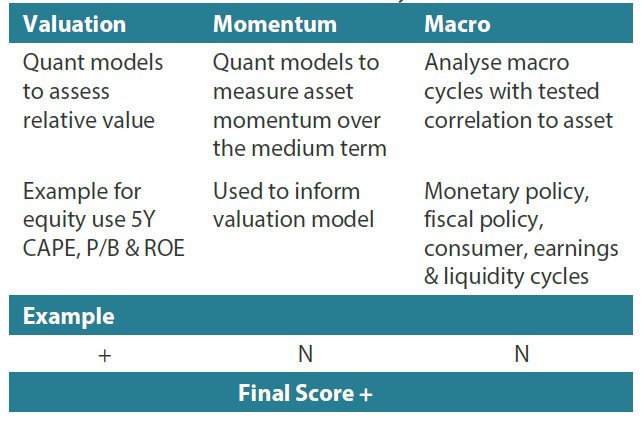
1The Multi Asset team’s cross-asset views are expressed at three different levels: (1) growth versus defensive, (2) cross asset within growth and defensive assets, and (3) relative asset views within each asset class. These levels describe our research and intuition that asset classes behave similarly or disparately in predictable ways, such that cross-asset scoring makes sense and ultimately leads to more deliberate and robust portfolio construction.
2The asset classes or sectors mentioned herein are a reflection of the portfolio manager’s current view of the investment strategies taken on behalf of the portfolio managed. The research framework is divided into 3 levels of analysis. The scores presented reflect the team’s view of each asset relative to others in its asset class. Scores within each asset class will average to neutral, with the exception of Commodity. These comments should not be constituted as an investment research or recommendation advice. Any prediction, projection or forecast on sectors, the economy and/or the market trends is not necessarily indicative of their future state or likely performances.


