Snapshot
The markets continued their ascent in July; however, amid early signs of volatility the strong start to the month was largely undone by the end. The earnings outlook was good in July and within the US, a large majority of companies continued to surprise on the upside with their earnings. Despite this, some nervousness towards large US Tech firms become evident. Strong earnings results were often met with disappointment, as the markets began to question whether the large amounts of capital investment into artificial intelligence (AI) would be able to generate strong enough returns. Furthermore, the markets have become fixated on the timing of the first rate cut by the Federal Reserve (Fed) as US unemployment continued to creep higher and there were early signs that inflation was beginning to ease. This led to the first Fed rate cut being priced for September, with the markets expecting almost 200 basis points (bps) of cuts to come over the following 12 months. In our view, this should help quell the rising volatility and see risk assets perform through the end of the year.
Outside of the US, the markets turned their focus on Japan as the Japanese yen rallied and equity markets sold off. The Bank of Japan (BOJ) hiked interest rates to 0.25% late in July and delivered messaging that it would review their bond purchasing program. The markets initially took the news positively; however, two days later, the situation was completely reversed. As the yen began to rise, the short yen carry trade was unwound, causing a sell-off across risk assets globally. Since Japanese equities are highly correlated with the yen, the country’s market showed signs of stress which ultimately led to panic at the beginning of August. This type of turmoil is typically enough to slow down a central bank; however, the markets still appear to believe that the BOJ will be able to maintain its hawkish path, potentially providing the yen with continued support.
Cross-asset1
For the month of August, we reduced our overweight on growth assets and maintained a neutral position on defensives. While we reduced our weighting on growth amid the volatility in the markets, we still kept our exposure significantly above neutral. This is due to a number of positive factors still in play, including seemingly imminent interest rate cuts from the Fed, earnings surprises remaining above their historic average, stronger-than-expected US economic growth and large fiscal spending globally from governments to support growth. As inflation has started to recede and unemployment rises, this paves the way for the Fed to begin easing, joining the European Central Bank (ECB), Bank of England and Bank of Canada, who have already begun reducing interest rates. Typically, risk assets perform best in an environment when purchasing managers’ indices (PMIs) move from contraction to expansion amid supportive monetary policies. This should also lead to more opportunities within the defensive side of the portfolio, as lower interest rates will favour fixed income.
Within growth’s cross-asset scores, specifically developed market (DM) equities, we reduced our exposure to Europe and the UK while we retained our preference for the US on the back of better visibility driven by secular growth themes. We increased our overweight on Japan due to its longer term structural story of improving corporate governance and earnings growth momentum. However, with the near-term headwinds coming from the yen’s appreciation in mind, we aim to slowly add capital on market corrections. We also decreased our overweight in energy and industrial metal given heightened volatility and shifted towards more defensive MLP assets. Within infrastructure, we increased our weight in US utilities on attractive valuations, reflecting our constructive view of the asset class driven by increasing energy demands due to AI development. We maintained our underweight to emerging market (EM) equities on better risk rewards found in DM equities despite relative valuation. However, we continue to favour selective countries such as India, which continues to benefit from a domestically driven economy and structural long-term growth story.
Within defensives, we marginally increased investment-grade (IG) credit, which is now slightly overweight, while maintaining an underweight position in DM sovereigns. While IG credit spreads remain tight with some countries such as the US trading close to post-global financial crisis lows, the increased prospect of interest rate cuts should support spreads, in our view. We find Canada relatively more attractive in terms of spreads. We expect the dovish stance of its central bank to support both spreads and outright interest rates. For DM sovereigns, we have a similar preference for Canada and the EU. However, more recently, we increased our exposure to the US and reduced our weight in Australia. The adjustment is based on the notion that Australia has higher inflation and a more hawkish central bank, whereas the US is likely on the verge of lowering interest rates. Previously, we were cautious about adding to bond markets with highly inverted yield curves; however, we now have a more favourable view of longer-term bonds given the recent yield curve steepening and the potential for interest rate cuts.
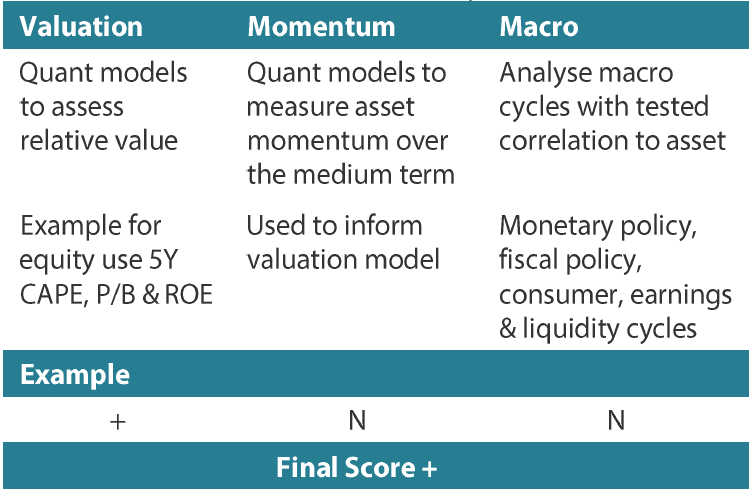
1The Multi Asset team’s cross-asset views are expressed at three different levels: (1) growth versus defensive, (2) cross asset within growth and defensive assets, and (3) relative asset views within each asset class. These levels describe our research and intuition that asset classes behave similarly or disparately in predictable ways, such that cross-asset scoring makes sense and ultimately leads to more deliberate and robust portfolio construction.
Asset Class Hierarchy (Team View2)
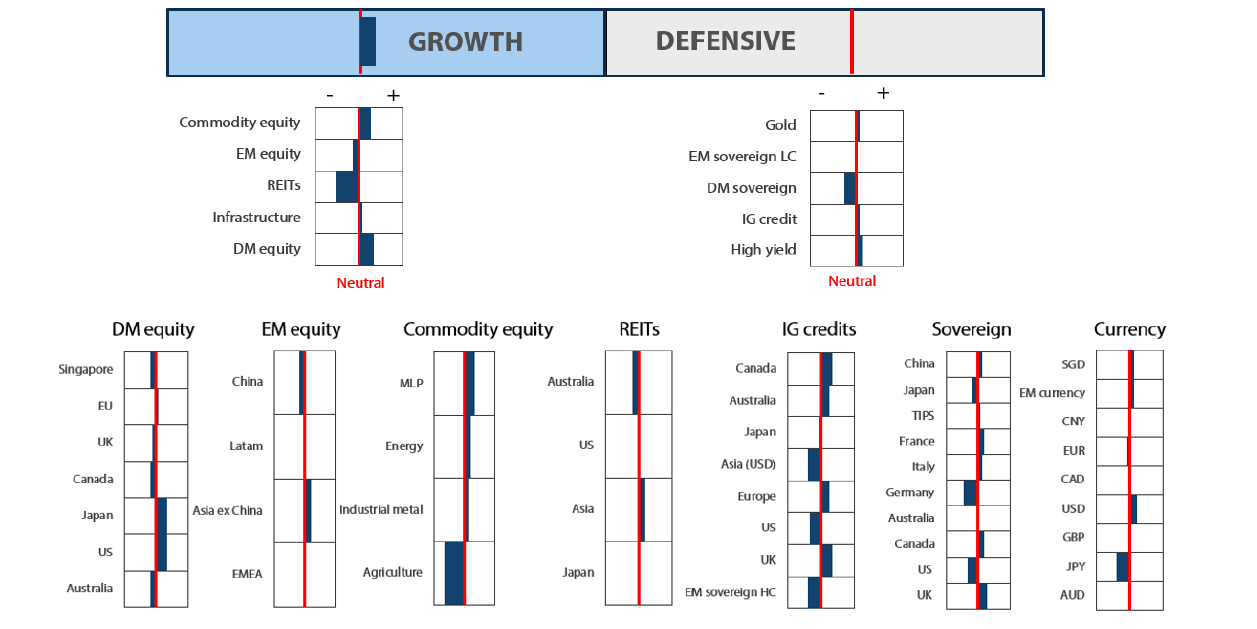
2The asset classes or sectors mentioned herein are a reflection of the portfolio manager’s current view of the investment strategies taken on behalf of the portfolio managed. The research framework is divided into 3 levels of analysis. The scores presented reflect the team’s view of each asset relative to others in its asset class. Scores within each asset class will average to neutral, with the exception of Commodity. These comments should not be constituted as an investment research or recommendation advice. Any prediction, projection or forecast on sectors, the economy and/or the market trends is not necessarily indicative of their future state or likely performances.
Research views
Growth Assets
Growth assets remain attractive despite sentiment recently being weakened by softer-than-expected economic data and the unwinding of carry trades with the strengthening of the Japanese yen. Historically, the third quarter has statistically been weaker, especially over the past five years. Considering the strong performance of equity markets year-to-date, we would not be surprised if investors are taking the opportunity to dial back on risk exposure and pause given the increasing volatility. We view the current market corrections as attractive entry points within a longer-term secular growth story.
Taking a pulse and drilling deeper into the current reporting season
Taking a look at the current reporting season, more than 80% of the S&P companies have already reported their earnings. The earnings so far have held up quite well, with about 79% of the reporting companies beating street estimates (Chart 1). This is better than the historical average of 72%. However, only 45% of the companies that have reported have exceeded sales estimates, which is below the historical average of 55%. What this implies is that while companies are beating expectations in terms of the bottom line, they are struggling with their top line, or revenue. This could be reflective of the current economic cycle which is slowing down as a result of the delayed impact of restrictive monetary policy. However, a more dovish stance from the Fed could ease these headwinds and kickstart an economic upcycle which would be positive for risk assets.
Chart 1: Earnings holding up better than expected
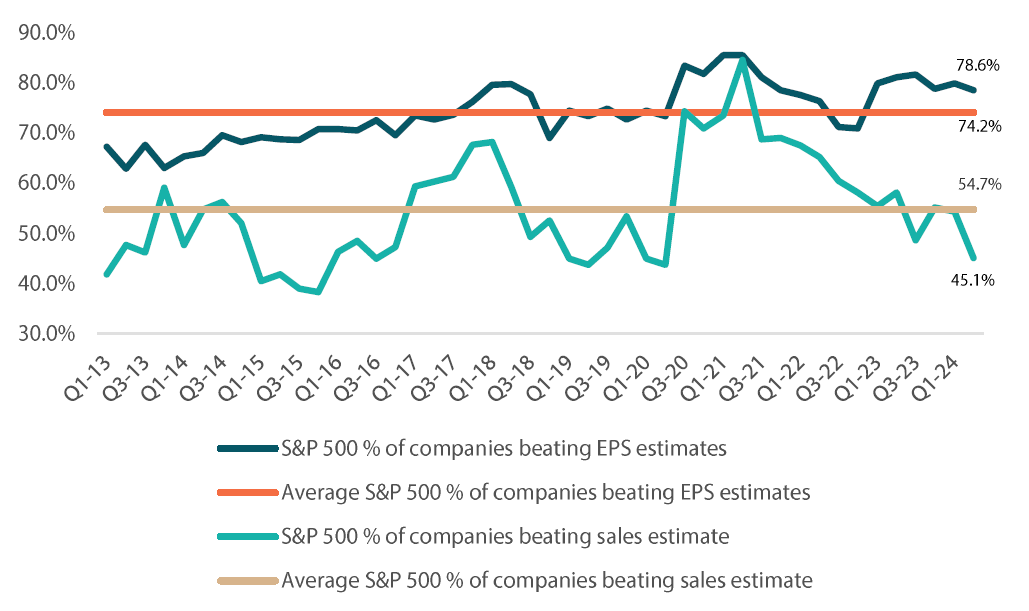
Source: Bloomberg August 2024
Similarly, we are also seeing earnings beats causing less surprises compared to previous quarters (Chart 2). This is due to the higher expectations set by the market following strong earnings beats over the past few quarters. We view the current quarter as a healthy reset of corporate earnings expectations, setting the stage for upcoming quarters.
Chart 2: Magnitude of earnings surprise not as strong as previous quarters
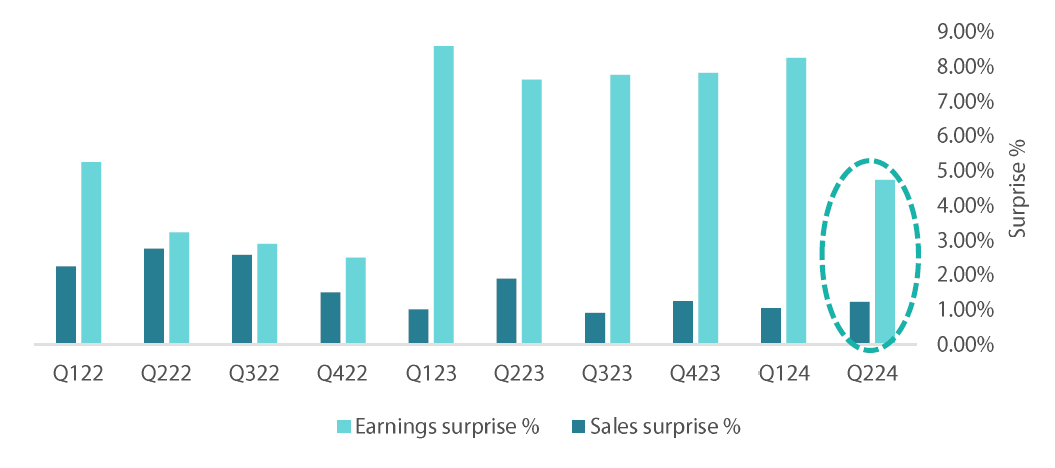
Source: Bloomberg August 2024
Looking more closely at the performance by sectors, financials, healthcare, industrials and technology were the standouts of the latest reporting season (Table 1). While the first three sectors were rightly rewarded by the market, technology was sold down amid investor concerns that the returns from capital expenditure on AI may not match up with the investments. We view the correction as a knee-jerk reaction by investors and an opportunity for them to take profits given the strong rally year to date. Such market corrections could be opportunities to partake in a compelling growth story over a longer-term investment horizon.
Table 1: Certain sectors are performing better than others
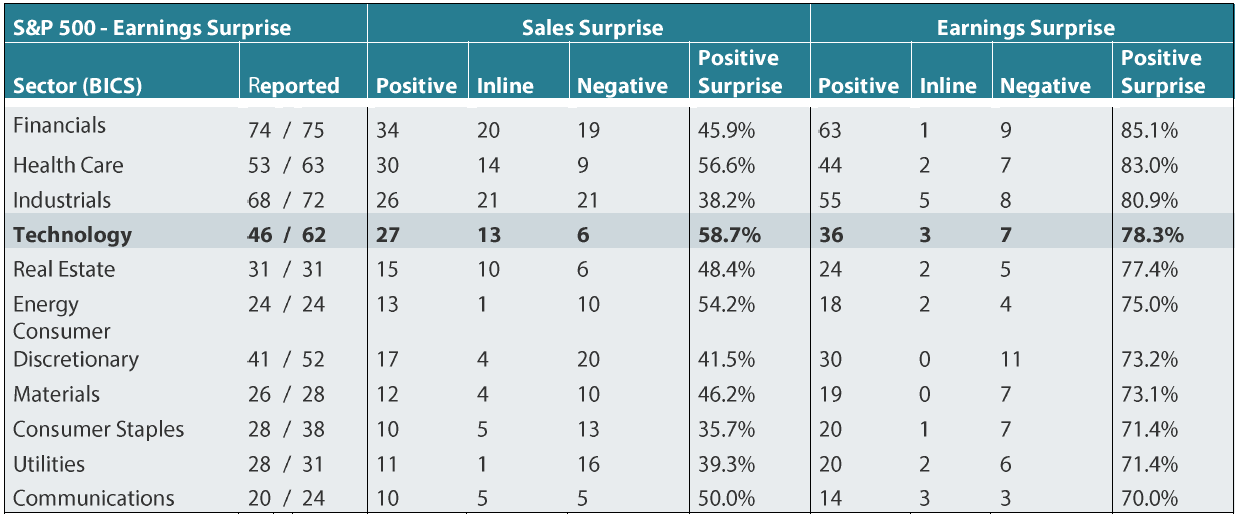
Source: Bloomberg, August 2024
Conviction views on growth assets
Exposure to US secular growth maintained: We continue to favour US tech-related stocks despite the recent hits to sentiment. Corporate earnings have been resilient, and the secular long-term growth story for the sector remains intact. Within the US, we are also starting to see the rally extend beyond the Magnificent Seven, which is positive for the overall market. As the economy slows and inflation comes under control amid a more dovish monetary policy, we expect risk assets in the US to perform well.
Exposure to Europe reduced: We reduced our exposure to Europe as we see more compelling relative valuation in US equities. However, we still appreciate Europe in a portfolio context as it provides balance, offering value and cyclical growth opportunities. The start of a rate-cutting cycle by the ECB would be a positive tailwind for the region.
Overweight to Japanese equities increased: Japanese equities momentarily tumbled on the back of an unexpected appreciation by the yen. The situation was dangerously close to a perfect storm as the BOJ’s rate hike, its first in 17 years, and the release of weak US payroll data took place within a span of a few days. We had previously reduced our overweight in Japan but valuations now appear compelling again. We are still convinced of Japan’s structural reform story in which we expect companies to either start deploying their capital via capex or return it to shareholders. We look to gradually increase our weight during market corrections.
Energy and industrial metals within commodity-linked equities toned down: Given the heightened volatility, we have reduced our exposure to energy and industrial metal equities, shifting the weights into more defensive asset classes like MLPs and US utilities. We retain our view that energy and industrial metal equities will continue to provide good diversification against inflation in the longer term, but we tactically reduced our weights due to the near-term volatility. The fundamentals of these sectors remain compelling due to both cyclical and secular factors.
Defensive Assets
Changes within defensive assets were relatively small this month. Currently, the portfolios are positioned to take advantage of rate cuts occurring in Canada and Europe. We have long viewed these two locations as the most likely to move rates first, due to their below-trend growth and the faster pace at which inflation is returning to the targets set by their central banks. This contrasts with the US, where inflation still remains above 3%, and growth looks more resilient than expected. Currently we think the Fed is likely to be more hawkish than the markets expect but is also preparing for its first rate cut towards the end of this year. Within the EM local currency positions, we continue to favour India due to the continuation of current policies under Prime Minister Narendra Modi’s administration following his election win, and a stable Indian rupee.
The BOJ and short yen
After telegraphing their intention to begin hiking rates, the BOJ followed through late in July with its second interest rate hike of the cycle, bringing the interest rate to 0.25%. From an economic perspective, the Japanese economy appears to be generating enough inflation, currently at 2.8% year-on-year (YoY), to justify this outcome. More positive however, is the wage trends in Japan. Recent data showed that the Japanese employment market is continuing to strengthen, with wages increasing by 4.5% YoY (Chart 3). After many years of struggling to produce any price pressures, it is becoming more likely that the BOJ will be able to maintain a positive interest rate, which for many years had been negative.
Chart 3: Japan monthly wage growth, % YoY
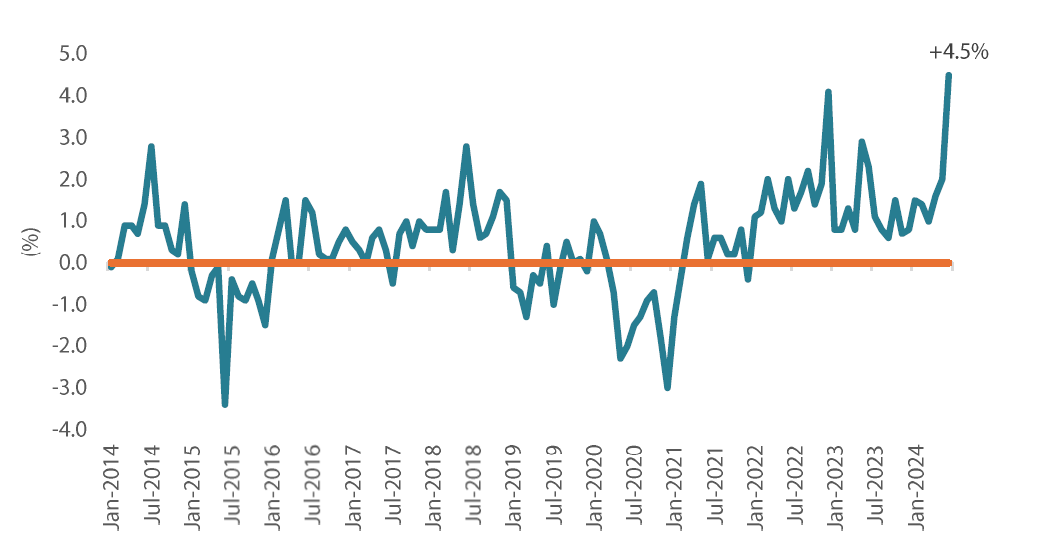
Source: Bloomberg, July 2024
The yen is one of the key risks to the BOJ being able to maintain higher interest rates. Over the past two years, it has been extremely profitable to own a short yen carry trade, which produced a yield pickup of over 6% when taking US dollars. This saw the yen devalue considerably versus its counterparts of major economies, helping to generate inflation as the currency dropped by 50%. This resulted in higher imported inflation and considerable profits for Japanese firms that received offshore revenues. Since interest rate differentials (shown in Chart 4) dictate the amount of carry, the BOJ hiking rates while the Fed eases monetary policy will alleviate some of the selling pressure on the yen. This would supportive the yen and ultimately ease inflationary pressures. Looking ahead, while we expect the BOJ to maintain their hawkish stance, the central banks’ resolve on how fast they want to raise interest rates could be questioned if the yen rallies past 140 to the dollar.
Chart 4: Japan/US real yield differential and yen
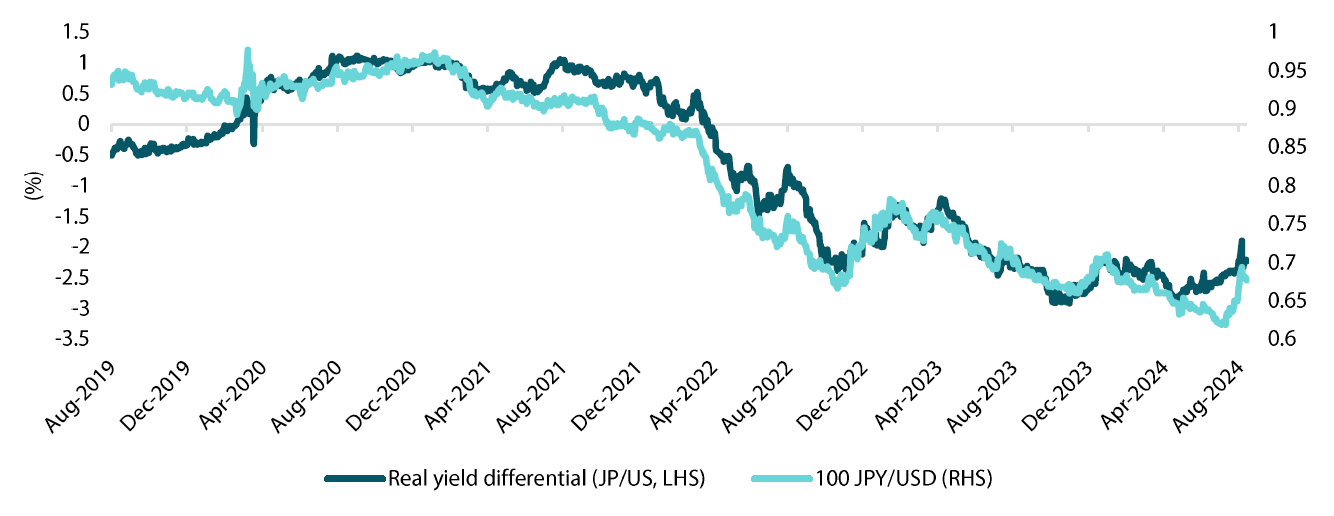
Source: Bloomberg, August 2024
From a portfolio strategy perspective, we remain cautious of Japanese duration and are becoming more wary about yen shorts despite the high levels of carry available. Regarding Japanese bonds, we would consider 10-year yields as attractive when they reach 100 bps over cash. If the BOJ can follow through with their rate hikes, that would put a target level of 1.5% on the 10-year bond as an attractive option. Alternatively, we could become more positive about the bond market if the yen continues to rally, as this could open up an opportunity to buy Japanese bonds as inflation will more rapidly reach its target.
Conviction views on defensive assets
Short-dated IG credit: Credit spreads remain at fair levels, but many markets still exhibit inverse yield curves, making longer-dated credit less appealing. As curves begin to steepen, we will look to shift this position. However, the current curve inversion still makes these positions appealing.
Gold remains an attractive hedge: Gold has been resilient in the face of rising real yields and a strong dollar, while proving to be an effective hedge against geopolitical risks and persistent inflation pressures.
Adding duration: As central banks begin to lower rates, this should be beneficial to bond markets globally. Picking the timing for rate cuts can be difficult; however, an end to restrictive policies should be positive for bonds.
Process
In-house research to understand the key drivers of return: