Snapshot
Defying seemingly broad sentiment that a slowdown is coming “any time now”, the US economy continues to chug along, and bond yields are continuing to wake up to the monetary reality that long-term rates need to be repriced accordingly. The adjustment has been aggressive and fast and it was getting disorderly towards early October. Still, there is a natural limit to these types of moves—either something breaks and policymakers respond, or tight policy slows growth and bonds look attractive again.
The sell-off involving a tight correlation between bonds and equities is reminiscent of 2022. However, in 2022 both growth and earnings were slowing while the US Federal Reserve (Fed) had much further to tighten; in contrast, we are seeing decent growth, upward earnings revisions and rates that are perceived to be much closer to central banks’ targets in 2023. This dynamic does not feel quite right given where we are in the tightening cycle. That said, in the US aggressive monetary tightening has never been combined with massive fiscal deficit spending, which may just be the ultimate neutraliser.
If growth slows or something breaks—think UK pensions in September 2022 or US regional banks in March 2023—bonds could rally and buffer equity declines, but if the economy and financial system stay stable, better earnings are expected to bode well for equities. We continue to watch closely the contours of growth and inflation, looking for inflection points to a potentially more dangerous regime. But short of material evidence, we remain constructive both on the growth outlook and the pricing of rates which are fast approaching fair value.
Cross-asset1
We maintained our overweight to growth assets and marginally increased our score for defensives to a slight overweight. Sentiment has grown quite weak across global equity markets in the process of pricing in “high for longer” Fed policy, which is less intuitive in the sense that this condition implies healthier growth corroborated by a still-improving earnings outlook. Still, given the strength of the near year-long rally since the market lows struck in October 2022, and only briefly interrupted by the banking crisis in March 2023, consolidation was warranted and the pullback appears healthy. It is reasonable to interpret the market correction as the pricing in of prospective economic weakness not yet visible in the data. On balance, however, it appears fiscal stimulus in the US, tech investment opportunities, some improvement in China and moderate growth elsewhere outweigh the risk of economic weakness for now.
At the same time, we consider developed market (DM) rates to be more attractively priced. DM rates offer attractive yields and a potentially sizable upside if growth eventually succumbs to tighter central bank policy; we therefore upgraded our view of defensive assets. While equities and bonds have been positively correlated to the downside of late, we expect negative correlations to return. Negative correlations could provide a buffer if fears of slowing growth return.
Within growth, we lifted commodity-linked equities again given that they would be a natural hedge if inflation remains sticky in the months ahead. Once again, we funded this increase from small reductions in DM and emerging market (EM) equities. Within defensives, we increased investment grade (IG) credit to a small overweight, funded from DM sovereigns. While we trimmed our view on DM sovereigns, we believe that their yields are attractive when considering factors such their defensive duration characteristics in addition to growth dynamics.
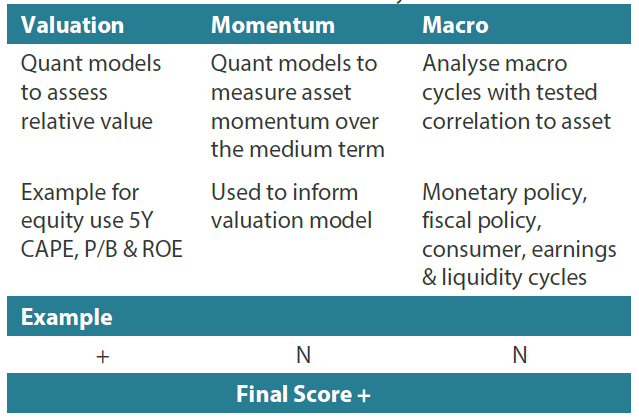
1The Multi Asset team’s cross-asset views are expressed at three different levels: (1) growth versus defensive, (2) cross asset within growth and defensive assets, and (3) relative asset views within each asset class. These levels describe our research and intuition that asset classes behave similarly or disparately in predictable ways, such that cross-asset scoring makes sense and ultimately leads to more deliberate and robust portfolio construction.
Asset Class Hierarchy (Team View2)
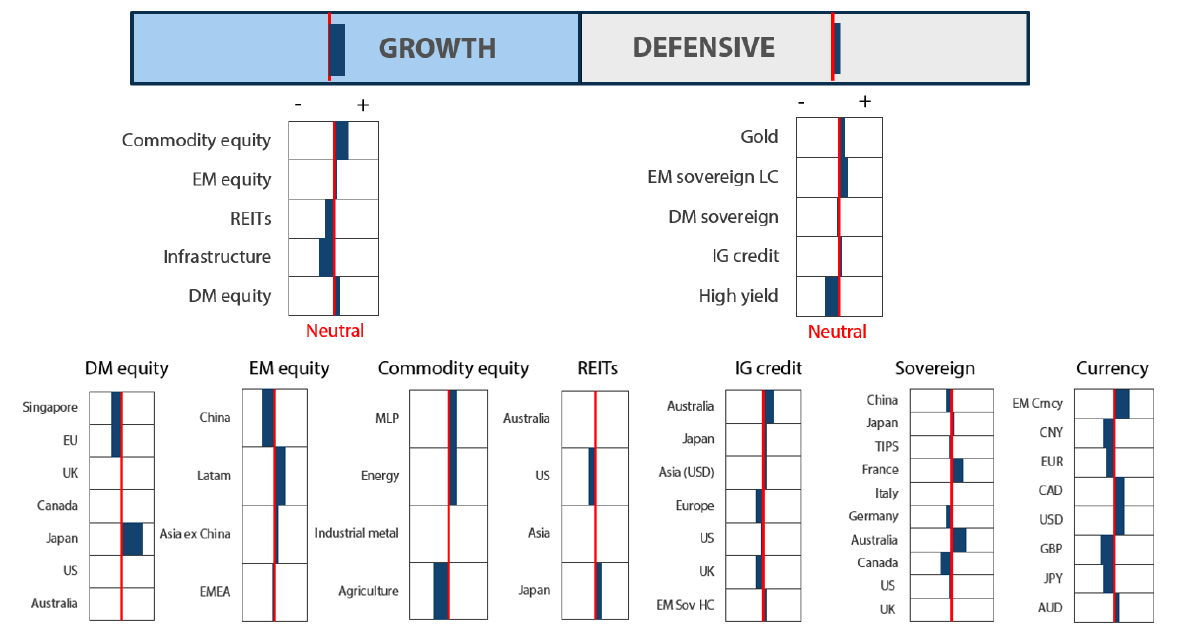
2The asset classes or sectors mentioned herein are a reflection of the portfolio manager’s current view of the investment strategies taken on behalf of the portfolio managed. The research framework is divided into 3 levels of analysis. The scores presented reflect the team’s view of each asset relative to others in its asset class. Scores within each asset class will average to neutral, with the exception of Commodity. These comments should not be constituted as an investment research or recommendation advice. Any prediction, projection or forecast on sectors, the economy and/or the market trends is not necessarily indicative of their future state or likely performances.
Research views
Growth assets
We are positive on growth assets with a particular focus on Japan and the US for their better growth position relative to other geographies around the world. Of course, when markets fail to respond to upside fundamentals including decent growth and earnings support, it does give us a reason to pause and consider what we might have missed in the recent market downturn.
US earnings revisions inflected from negative to positive around February 2023, and this inflection has been an important pillar of equity market price support. This is the market’s outlook from a bottom-up perspective driven by company guidance and to some extent, analyst foresight, and we believe that such an outlook can support equity prices barring a surprise economic downturn.
From a top-down perspective, market participants have been bearish, expecting a recession around the corner, but data have yet to reflect this scenario. While it is accurate to point to the risk of a slowdown driven by aggressive monetary tightening to date, we believe the market is underestimating the significant countervailing force of fiscal deficit spending that has largely muted monetary tightening.
As we reflect on growth dynamics, we believe the drivers of demand are real and sustainable where recent market volatility was likely more a reflexive adjustment to fast-moving long-term rates. As we believe rates are close to fair value and that most of “higher for longer” has been priced in, rates could stabilise from here and allow 3Q23 earnings to support equities.
Sticking with Japan and US equities
We have been constructive on Japan equities for some time, mainly for the country’s structural reforms that are likely to bear fruit as the economy finally exits more than 30 years of deflation. Most importantly, rising inflation is requiring companies to put capital to work to support secular improvement on return on capital, which can last for some time.
Japan corporates also benefit from still easy monetary policy, high nominal growth, a weak yen as well as new investment where the country offers an easy alternative access to Asian manufacturing and demand as companies and governments still seek diversification outside of China.
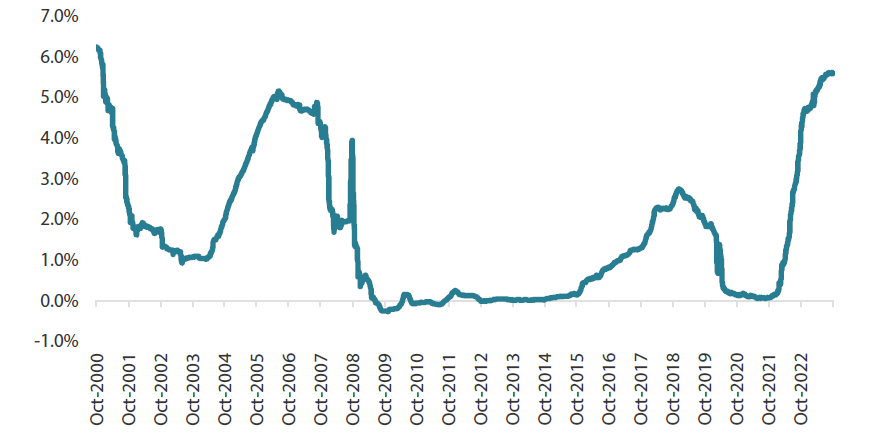
There is also another very compelling reason Japan is attractive. The reason is the forex (FX)-hedged yield, which is currently +5.6% for a US investor. When taking foreign equity exposure, FX risk is either accepted as part of the total risk or hedged. Typically, the cost of FX hedging is a secondary consideration, but given the +5.6% yield pick-up amounting to a total yield of 7.8% (dividends plus hedging), Japan equities, in our view, are compelling choices both for domestic and foreign investors.
Chart 1: +5.6% yield from currency hedging (Japanese yen to US dollar) for a US investor
Source: Bloomberg, October 2023
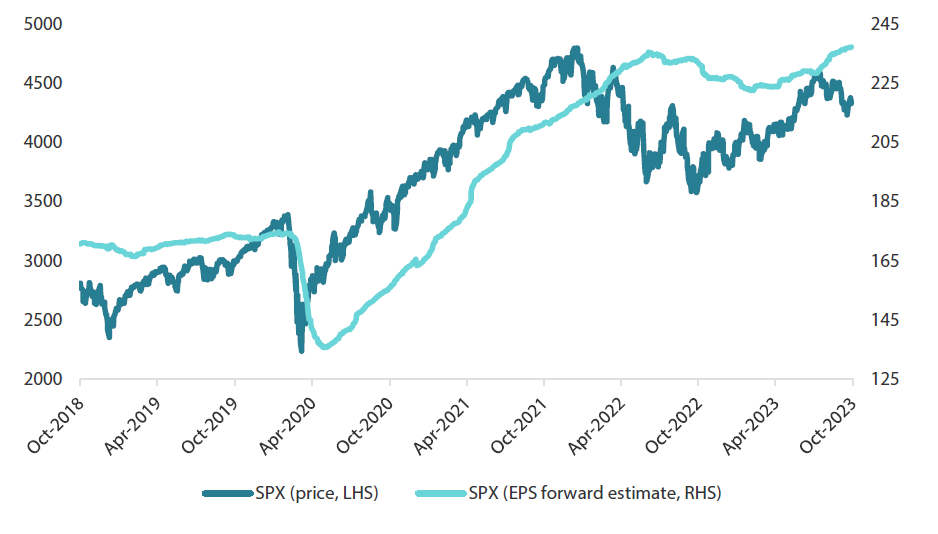
As mentioned before, earnings have been revised higher since February of 2023, while the divergence from equity prices has grown quite considerable in recent months—upward earnings revisions are accelerating while price has remained under pressure (see Chart 2).
Earnings revisions are forward looking, but they rarely (if ever) price a downturn before the market has already sold off as shown in Chart 2—see 2020 and 2022. Earnings estimates also lag in pricing upturns; the S&P 500 bottomed in October 2022, while earnings did not bottom until February 2023.
Today, S&P 500 earnings are projected at US dollar 237 per share, which is an all-time projected high while the S&P 500 is priced at 4,328 points, 7.6% below the early 2022 high of 4,800. Equities are not exactly “cheap”, but in our view they are reasonable at 18.2x today versus 22.0x in early 2022 in terms of price-to-earnings.
We have a constructive view on US equities, mainly for the strength of the economy which appears supported by the fiscal impulse. We also see secular growth opportunities (e.g. artificial intelligence) for which we have a particularly constructive outlook.
Chart 2: S&P 500: price versus earnings per share forward estimate
Conviction views on growth assets
- Still favour Japan and US: Our positive view remains stable. We believe the sell-off that began during the summer months, running through early October, was more driven by the lift in rates than concerns for growth. We believe long-term rates are close to fair value, which should take the pressure off equities supported by growth and earnings.
- Commodity-linked equities a favourable rates hedge: Energy prices remain resilient, which is ostensibly a risk to central banks getting inflation down to their target levels. We favour energy and commodity-linked equities more broadly as a natural hedge to inflation risk and rising rates.
- Global inventory cycle: We believe that the inventory cycle is turning, which helps support demand in general and favours export economies like South Korea and Taiwan as well as Japan, which is a large exporter in absolute terms.
Defensive assets
We slightly downgraded our view on sovereign bonds within our defensive asset classes. Central banks are in the final stages of monetary policy tightening as inflation continues to retreat. However, employment in most economies remains resilient to tighter policy and suggests that official cash rates will hold at restrictive levels, pushing potential rate cuts further out into 2024. Global bond yields have been adjusting to this "higher for longer" narrative as longer-term rates rise towards cash rates and reduce the degree of inversion in yield curves.
Conversely, our downgrade to sovereign bonds was countered by an upgrade to IG credit this month. This asset class currently has positive valuations and momentum, although we need to keep in mind that the macro environment has been slowly deteriorating. So far through 2023, the global economy has performed stronger than expected, and this has seen IG spreads become more resilient. US growth still looks robust and the potential for the economy to avoid a recession should see IG spreads grind tighter for the rest of 2023.
We maintained our negative view on high yield (HY), strongly preferring high grade credit. HY bond spreads continue to perform well in 2023, despite the economic slowdown occurring through Europe. While the asset class has positive momentum, valuations are now tight as spreads trade below their long-term average. Given the large amounts of monetary policy tightening that has occurred and the potential for increasing bankruptcies, we see this asset class as having greater risk of poor performance.
Higher for longer
The Fed delivered its eleventh interest rate rise in this cycle at its July meeting, bringing the total change to 5.25% and marking the most aggressive tightening of monetary policy since the 1980s. The current level of the Fed funds rate is now close to Federal Open Market Committee (FOMC) members’ expectations as outlined in their most recent Summary of Economic Projections. The jury is still out as to whether one more rate hike will eventually be delivered but we have very likely reached the end of this cycle.
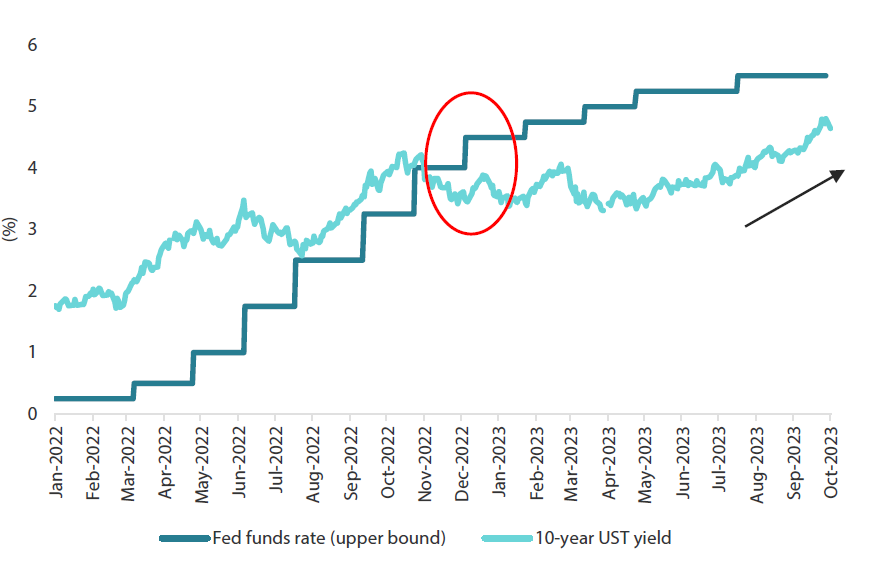
With the Fed’s tightening cycle potentially nearing its end, a noticeable shift in FOMC member communication has begun to occur. Members seem less focused on the potential to raise the Fed funds rate even further. Rather, they appear more focused on keeping rates elevated for longer than market pricing has been indicating. This disconnect in expectations between the Fed and market pricing began to appear almost 12 months ago. Chart 3 shows the rise in the Fed funds rate versus the 10-year US Treasury (UST) yield since the start of the tightening cycle. The circled area indicates when longer-term bond yields started to resist the rate hikes being delivered by the Fed.
Chart 3: Fed funds rate versus 10-year UST yield
Source: Bloomberg, October 2023
This yield curve inversion, where 10-year yields crossed below the Fed funds rate, happened about midway in this rate hike cycle. In the four tightening cycles since the 1990s preceding the current one, the 10-year yield peaked at or often reached levels well above the eventual terminal rate. These episodes were likely within the Fed’s expectations when the central bank hiked rates; in other words, lifting the Fed funds rate to higher levels is effectively a signal to the markets that yields across the curve should also rise. Which brings us back to the present where the US yield curve began to rise with the start of the hiking cycle in line with historical observations before breaking from these norms in late 2022. The Fed lifted rates five more times and longer-term yields failed to follow, leading to a substantial (and very early) inversion of the yield curve.
So why does this matter? From our perspective it matters for two main reasons. The first is that when longer-term rates do not keep up with rising cash rates, it likely results in monetary policy tightening having an uneven impact. Sections of the economy that rely on shorter-term borrowing rates feel the full brunt of rate rises while other segments that can borrow for longer terms are more insulated. This effectively means that the Fed is getting “less bang for its buck” than in a more typical cycle where all rates rise along with cash rates.
The second reason is also a reflection of the first, in that the economic impact of the rate hikes are also slow to materialise. Real US GDP in the first half of 2023 continues to grow at slightly above historical average growth rates and current projections for third-quarter growth indicate more of the same is expected. While the lack of a more uniform rise in rates is not the only reason for the strong economy—fiscal policy has likely also been a significant contributor—we believe it has been an important factor. Which brings us back full circle to the Fed officials’ change in tone with emphasis on a higher for longer path for interest rates and the recent rise in longer-term bond yields. While the Fed is indicating that the cash rate has reached a sufficiently restrictive level, markets are taking notice of the central bank’s message that a less inverse yield curve would also further its goal to slow growth and reduce inflation back to its objective.
Conviction views on defensive assets
- Australian rates still attractive: The Australian yield curve is still positively sloped, making it a better relative value than many of its peers, and its IG spreads are some of the widest in the developed world and offer above-average pickup to other markets.
- Attractive yields in EM: Real yields in this sector are generally very attractive and we prefer quality EM currencies against the backdrop of a generally weaker dollar.
Process
In-house research to understand the key drivers of return:
