Snapshot
The economic wheels continue to turn forward, surprising many given that the US Federal Reserve’s (Fed) overnight target rate has been lifted to 5.5%, a level not seen since 2001. It is also 25 basis points (bps) above the top rate of 5.25% seen back in 2006–2007, before rate cuts ultimately failed to prevent the unfolding of the Global Financial Crisis (GFC), punctuated by the collapse of Lehman Brothers in September 2008. This time around, balance sheets are much stronger in the private sector and so are regulations. And now, the combined fiscal impulse and investment wave may keep pushing recession risk further away.
The current risks instead stem from the adjustment to a much higher risk-free rate that challenges business models heavily reliant on a minimal cost of capital. As inflation declines and real rates continue to rise, the pain for these businesses will steadily increase. In the meantime, some of this pain can be digested so long as demand holds up. Equities and bonds are adjusting to “higher for longer” and while this shift in psychology may add to volatility and lift bond-equity correlations for now, it does not make the case for a broad market decline barring a larger market shock.
In hindsight, 2022 looks to have been mostly about a bond bubble bursting and a corresponding de-rating of expensive equities, but the expected downside in earnings never completely arrived and now forward earnings are trending up. Quality certainly matters as the rise in real rates will not be kind to leveraged companies. Of course, key to this continued growth theme is inflation continuing to glide lower, which is less of a risk for now but one that we watch closely.
Cross-asset1
We maintained our overweight view on growth assets and neutral outlook for defensives. The outlook remains stable with slower growth and tight policy having its desired effect of slowing inflation. However, a positive fiscal impulse, mainly from the US, has helped stabilise consumer finances; this, coupled with new investment in technology, is prolonging the economic cycle. Improving market breadth has contributed to the perception of reduced recession risk and the most beaten-down sectors and styles, ranging from US regional banks and energy to small-cap value, have received a decent lift.
While recession fears are being priced out, the 5.5% US risk-free rate is very high and a persistent hurdle for the economy to keep chugging along. Meanwhile, inflation continues to decline, eroding top line revenue growth while making it difficult for margins to be sustained. Advancements in artificial intelligence (AI) hold significant promise to ultimately lift productivity over the long term, but the speed of realisation is open to conjecture while higher real rates present an ongoing direct challenge to the still abundant business models dependent on cheap capital.
This will take time to play out, and so long as systemic fissures witnessed in liability-driven investment in the UK and US regional bank stresses along with the Credit Suisse collapse do not evolve into tectonic cracks, we suspect markets will continue to back this promising long-term opportunity.
Reflecting our view of continued cyclical normalisation, within our growth assets we lifted commodity-linked equities from underweight to overweight and also modestly lifted emerging market (EM) equities to a larger overweight, funded by a significant downgrade of listed infrastructure to a large underweight. Within defensives, we further reduced our underweight to investment grade ( IG) credit funded by a downgrade of developed sovereigns to neutral.
1The Multi Asset team’s cross-asset views are expressed at three different levels: (1) growth versus defensive, (2) cross asset within growth and defensive assets, and (3) relative asset views within each asset class. These levels describe our research and intuition that asset classes behave similarly or disparately in predictable ways, such that cross-asset scoring makes sense and ultimately leads to more deliberate and robust portfolio construction.
Asset Class Hierarchy (Team View2)
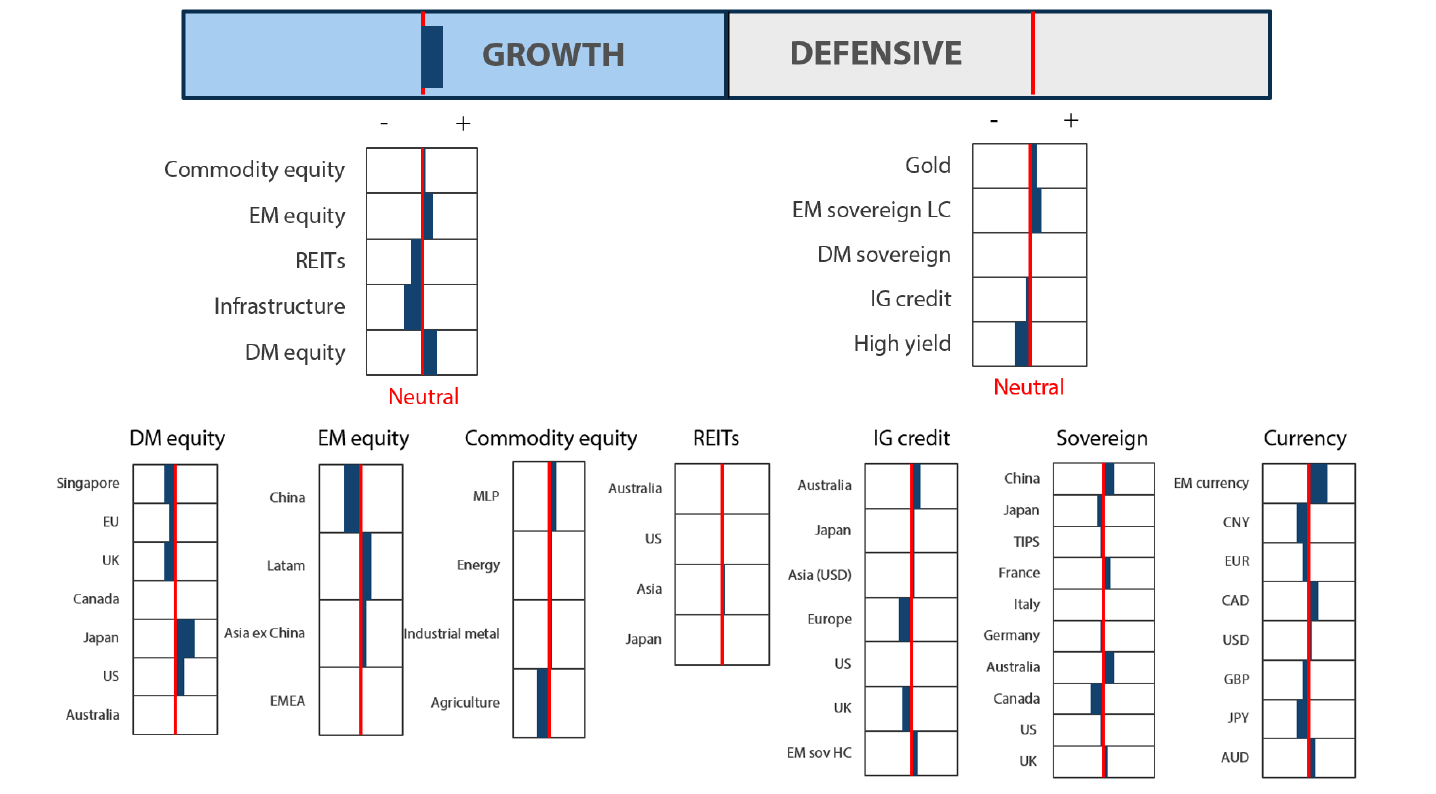
2The asset classes or sectors mentioned herein are a reflection of the portfolio manager’s current view of the investment strategies taken on behalf of the portfolio managed. The research framework is divided into 3 levels of analysis. The scores presented reflect the team’s view of each asset relative to others in its asset class. Scores within each asset class will average to neutral, with the exception of Commodity. These comments should not be constituted as an investment research or recommendation advice. Any prediction, projection or forecast on sectors, the economy and/or the market trends is not necessarily indicative of their future state or likely performances.
Research views
Growth assets
The goldilocks soft-landing scenario has continued to play out in favourable data prints, but the market has been less impressed, which is probably attributable to much-needed consolidation. Sentiment may have also shifted at the margin; it makes less sense to hold long-dated bonds if rate cuts are not coming any time soon, and the long-end of the curve has been lifted commensurately. Still, this looks more like digestion of a new reality than any new weight on earnings prospects.
This growth story is also a different journey—one of disruption that can be tantalising with imaginations captured by the likes of ChatGPT. But outside of Nvidia earnings that seemingly reflect firm tailwinds from graphics processing unit (GPU) demands, it is hard to see exactly how these new technologies will be monetised with any speed while tight policy is much more definitive in terms of ultimately weighing on demand. Still, fiscal policy is exceptionally accommodative and the stimulus packages to date have ways to run; therefore, demand might not give up so easily.
The major difference between today versus the last 20 years since the social media-focused dotcom bubble is that AI does seem to have the potential to boost real productivity in a way similar to how the spreadsheet and the internet lifted productivity in the 1990s. For example, Microsoft will soon be releasing a generative AI application called “Copilot” which will be integral to its Office suite, which has shown excellent results in terms of lifting productivity among the 600 paying companies that are now testing it.
There are suggestions that the “hype” over AI is overdone. However, we could begin to see more definitive earnings upgrades connected with AI in the not-too-distant future.
US tech: froth or for real?
Much has been made of US tech stocks nearly fully clawing back their losses from 2022, which were formidable, while Nvidia is up 38% from the end of 2021. Does this make any sense? To some extent, yes, but the proof will be in the pudding which largely hinges on the prospects for AI. The market broke for good reason in 2022 as stimulus-driven demand was beginning to wane and rates were fast on the rise, but then came ChatGPT in November 2022, adding one million users in just five days.
Chart 1: US tech stocks price change compared
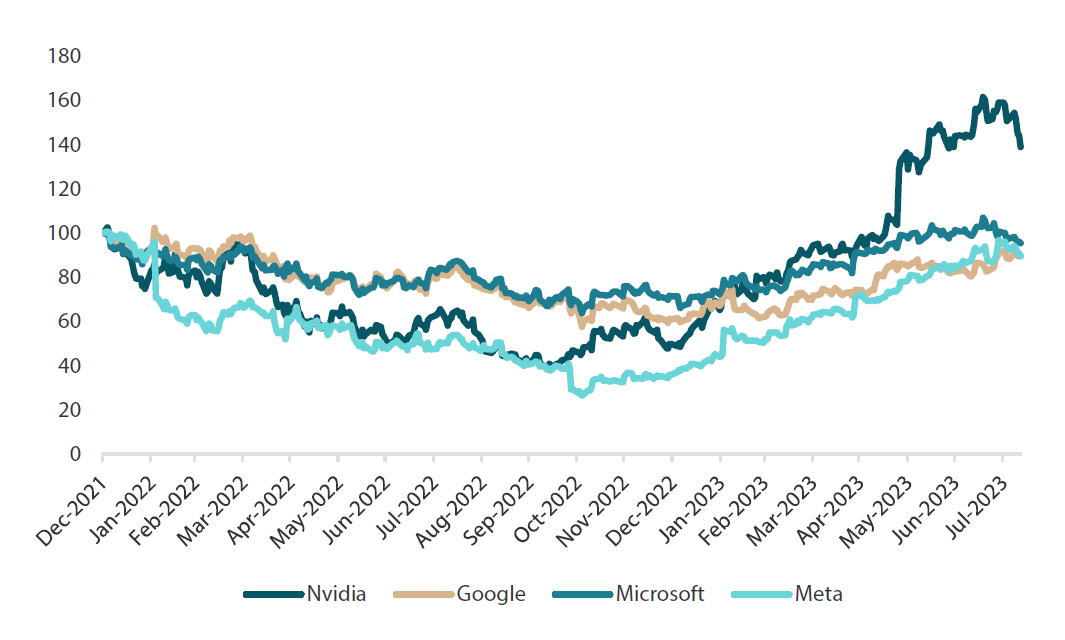 Rebased to 100 on 31 December 2021
Source: Bloomberg, August 2023
Generative AI is fascinating for its human-like writing skills and broad knowledge base. But what is the compelling business proposition? For Nvidia, the proposition is quite simple: demand for AI-grade GPUs is literally off the charts with back-orders into 2024 and Nvidia is by far the market leader in the AI-GPU space. The stock trades at expensive levels for sure, but demand and growth prospects are seen to be real as AI is not just a corporate initiative, but also a societal one where countries like Saudi Arabia are snapping up GPUs as much as they can order, ostensibly to stay current as AI is not just a nice-to-have, but a must-have from a sovereign security standpoint.
Generative AI is just one application, while behind the scenes, many more breakthroughs are taking place—like Google’s subsidiary, Deepmind, having produced an AI system called Gato, which has learned 600 tasks without formal training. This is more akin to Artificial General Intelligence (AGI)—a form of computer understanding that allows it to adapt (or reason) to learn novel concepts and perform tasks that extend well beyond answering questions and writing papers for its master. The point is that technical breakthroughs and compelling applications are developing at an ever faster rate while the potential boost to productivity could be profound.
We are natural sceptics as we need to be in the world of investing, and while we are cautious on the timeframe for realising these many potential benefits that will eventually reflect in earnings, we do believe that these innovations are very real—and far more interesting than the developments in social media over the last 20 years.
Conviction views on growth assets
- Still favour Japan and the US: Japan equities have stumbled with the (very) partial normalisation of policy, but it does not change the fact that policy remains easy while reforms remain promising. For the US, we believe the developments in AI are very real and so long as demand stays intact, the upside is significant across industries.
- Favour pockets of EM: We still like Latin America for its impending easing cycle and places like Mexico that benefit from near-shoring and US investment. Asia has paused for a breather, but South Korea and Taiwan still have favourable tech exposure while India benefits from cheap energy and potential new growth opportunities in manufacturing.
- Cautious on China and Europe: China continues to struggle in finding stable growth while Europe must contend with a technical recession and still challenging headwinds from ever-tighter policy.
Defensive assets
We downgraded our overweight view on developed sovereign bonds to neutral within our defensive asset classes. Global bond yields drifted higher over the month and most yield curves began to re-steepen off their most inverted levels for this cycle. Another round of central bank tightening was delivered although the messaging made a less hawkish turn. This should have been more supportive of global bonds but resilience in the US economy had traders repricing the potential of future rate cuts well into next year. The prospect of higher rates for longer means that central bank rates may have arrived at their destination, but it may be a long wait before yield curves need to factor in an extended easing cycle. While our view on developed sovereign bonds has been tempered, real yields in many EM local currency bonds remain very attractive. This real yield advantage is also supporting EM currencies relative to the US dollar and the Japanese yen.
We upgraded our view on IG credit score this month, to be only slightly underweight. The recent rally in equities paired with stronger-than-expected economic data has seen spreads perform well over the past few months. While we expect global growth to slow and tighter financing conditions to make the environment tougher for IG borrowers, the stronger-than-expected data means the global economy may not enter recession in 2023. This could see IG credit spreads remain contained for the short term. However, current levels alongside the lingering risk of recession means an overweight position is not yet warranted.
We have maintained high yield credit as our least favoured asset class within our defensives bucket this month. High yield spreads have performed particularly well this year, despite continued fears that a recession is near. Overall, the outlook for the asset class is uncertain, as slowing lead indicators and tighter financial conditions risk spread widening. While we acknowledge that the asset class has been resilient so far, the recent spread tightening makes the potential for negative outcomes greater should a downturn occur, and the potential upside of the asset class is reduced with tighter spreads.
Bank of Japan policy changes
At its policy meeting in July, the Bank of Japan (BOJ) took one of the first steps in removing its easy monetary policy setting, stating that it would now “conduct yield curve control with greater flexibility”. The details on what this “flexibility” entails were relatively scarce. However, the level at which the BOJ will buy bonds gives some foresight into just how this flexibility should operate. The BOJ stated that they would be willing to purchase 10-year Japanese government bonds (JGBs) at 1.0%, which is double the 0.5% which they were willing buyers of in the past month. The market took this message as a green light to sell bonds, pushing yields through the prior yield curve control level to their highest levels since 2014. We think that this messaging from the BOJ implies that they are comfortable letting yields drift towards 1%, as long as it occurs in an orderly fashion.
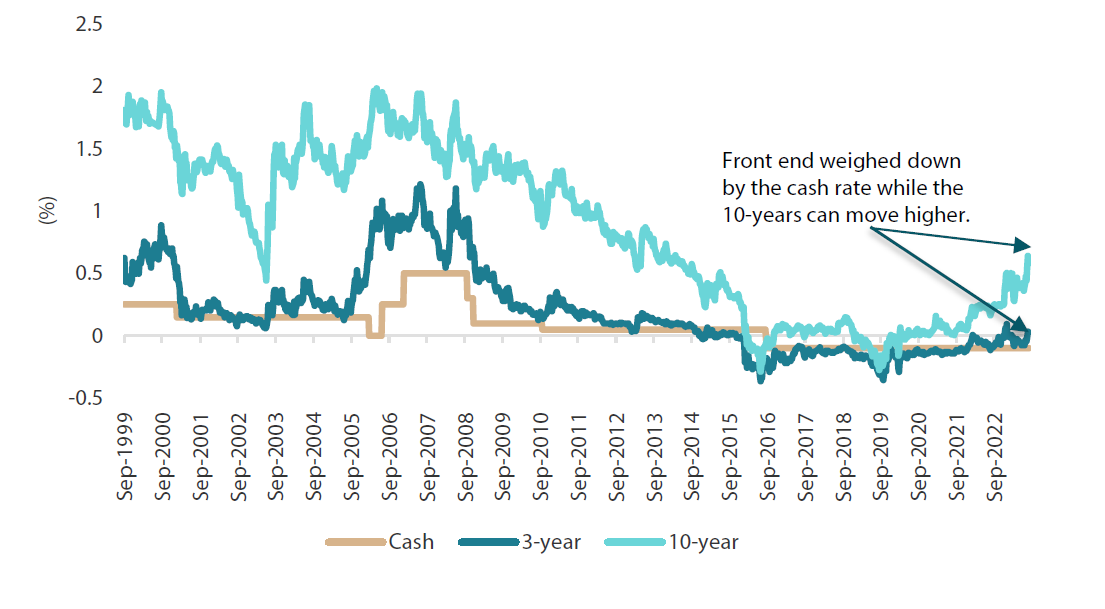
The policy stance change is also seen causing the Japanese yield curve to steepen, as 10-year yields move faster than shorter-dated bonds. The rationale for this is that while 10-year yields are allowed to drift higher, market expectations for the cash rate will remain relatively stable. As can be seen below (Chart 2), shorter-dated bonds typically trade around the cash rate, meaning front-end bonds will continue to be anchored until the BOJ signals that the cash rate is ready to move. This is a different outcome to Japan’s peers, where curve flattening is being driven by rapidly increasing cash rates. Not only do inverted curves signal that potentially weak economic growth is on its way, but bond market participants like steep curves as it creates an environment where longer maturity bonds produce better carry opportunities and yields naturally want to fall as time passes.
Chart 2: Japanese rates
Source: Bloomberg
After many years of being an unloved bond market, the shift in policy is creating two positive factors which is seen making JGBs look more attractive globally. Firstly, as described above, the Japanese bond curve is one of the steepest in the developed world, as curves of countries like the US, Canada, Germany and the UK are deeply inverted, making it increasingly difficult to favour long-dated bonds compared to shorter maturities in those markets.
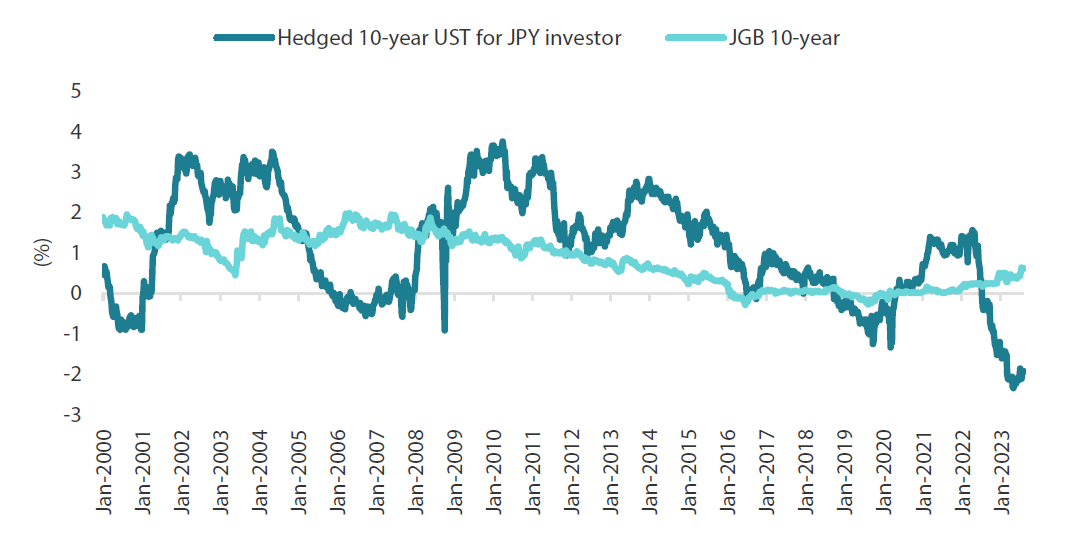
And secondly, because Japan has much lower cash rates than the rest of the world, the hedging costs are very favourable towards owning Japanese bonds. In fact, the hedged yield for a Japanese investor owning 10-year US Treasuries is around -2%, which is now substantially worse than the 0.5% yield available on JGBs of similar maturity (Chart 3). This is reaching historically wide levels and any continued sell-off is expected to make JGBs increasingly attractive to Japanese investors.
Chart 3: Hedged US Treasury yields versus JGBs
Source: Bloomberg
It may not yet be time to start taking an overweight view of JGBs, as the market will likely want to test just how far yields can move before the BOJ reacts. But that time could soon be coming, as a steep curve, favourable hedging costs and yields rising to10-year highs make for a much more interesting market.
Conviction views on defensive assets
- Australian rates still attractive: We expect that the Reserve Bank of Australia’s policy is very near to its terminal rate as inflation is cooling and consumer demand is showing signs of slowing. The Australian yield curve is still positively sloped, making it better relative value than many of its peers, and its IG spreads are some of the widest in the developed world and offer above-average pickup to other markets.
- Attractive yields in EM: Real yields in this sector are generally very attractive and we prefer quality EM currencies against the backdrop of a generally weaker dollar.
Process
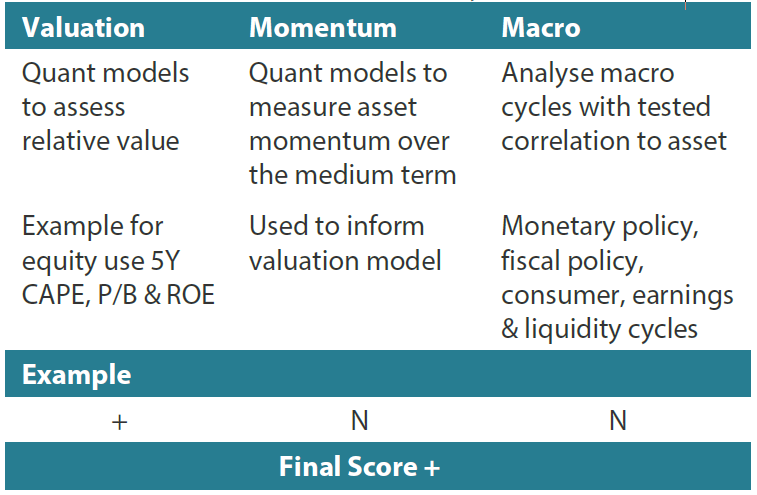
In-house research to understand the key drivers of return:
Any reference to a particular security is purely for illustrative purpose only and does not constitute a recommendation to buy, sell or hold any security. Nor should it be relied upon as financial advice in any way


