Background: Volatile start to 2022 for the broader bond market
War, inflation and aggressive central bank tightening
Most of us would agree that the bond market experienced a tough start to 2022 as a confluence of negative factors, notably the Russia-Ukraine war, a surge in global inflation and aggressive monetary policy tightening by the Federal Reserve (Fed) and other central banks exposed the market to a significant amount of volatility. Against such a backdrop, yields rose sharply across the world, with Asia being no exception.
Focus seen shifting from inflation to growth concerns
The Fed has hiked interest rates aggressively in the first half of 2022 in an attempt to tame inflation in the US, which hit a 40-year high, and the central bank is expected to continue tightening for the foreseeable future. However, we believe that the market has already priced in a significant amount of Fed tightening. US breakeven inflation rates show that inflation expectations are stabilising. The market’s focus is expected to gradually shift from inflation to economic growth concerns. This could ease pressure on US Treasury (UST) yields, which have surged so far in 2022 but may begin consolidating through the remainder of the year.
Economic conditions facing Asia bonds
Asia’s economic activity back to pre-pandemic levels
While many parts of the world struggle with inflationary pressures and other headwinds, how are Asian economies currently faring? Chart 1 shows that the purchasing managers’ indices (PMI) of most Asian countries are above 50, which represent expansion. Chart 2 shows that domestic activities (retail and recreation) in Asia have mostly recovered to pre-pandemic levels. We are currently seeing both manufacturing and domestic activities in a healthy recovery phase in Asia.
Chart 1: Manufacturing PMI in May 2022

Source: Bloomberg as at end-May 2022
Chart 2: Domestic activities in retail and recreation vs pre-covid levels (%)

Data is sourced from Google Community Mobility Report. The base value is the median during the 5-week period of 3 January–6 February 2020
Source: Bloomberg and Google as at end-May 2022
Inflationary pressures not as strong in Asia, central banks under less pressure to hike rates aggressively
Let us next look at inflation in Asia. Chart 3 shows Asia’s headline and core CPI. Both indices have climbed higher, although the rise is not as severe as in the US, Europe and Latin America. This is partly due to domestic subsidies implemented by Asian governments and their better management of the supply of some items such as foodstuffs.
Chart 3: Asia’s CPI vs other regions and countries
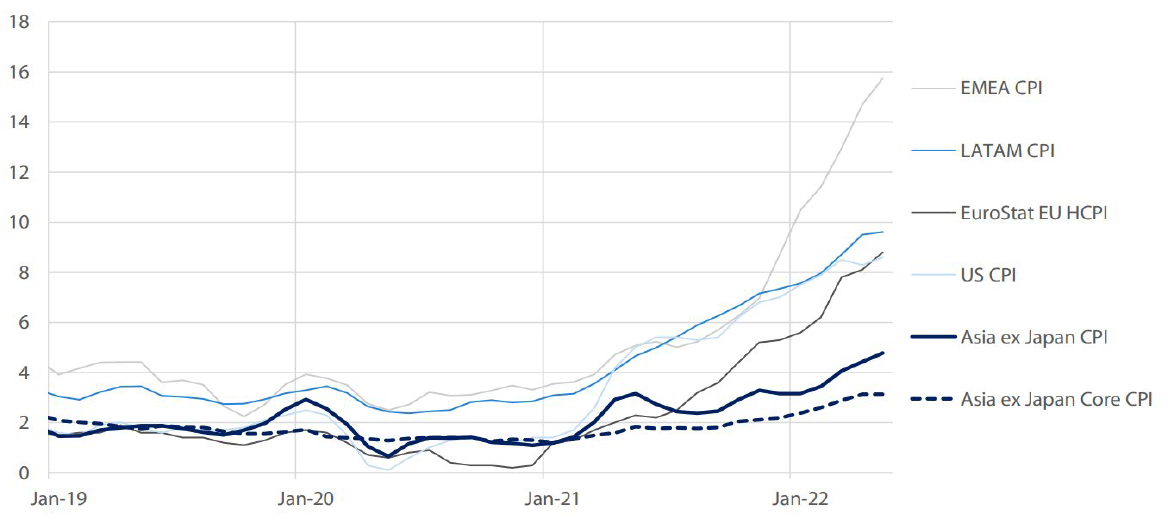
EMEA: Czech Republic, Egypt, Greece, Hungary, Poland, Kuwait, Saudi Arabia, South Africa, Turkey, Qatar
LATAM: Colombia, Brazil, Chile, Mexico, Peru
Asia ex Japan: Singapore, Indonesia, India, Malaysia, Thailand, Philippines, China, South Korea
Source: Bloomberg as at May 2022
What the current state of inflation in Asia means for monetary policy is that the region’s central banks are under less pressure to hike interest rates compared to their peers in other parts of the world. Chart 4 shows that some of these countries, such as Brazil, Mexico and Poland, have to be very aggressive in hiking rates to tackle inflation in their respective economies. Asian central banks, in contrast, can afford to take a more gradual approach to policy normalisation.
Chart 4: Central bank policy rates
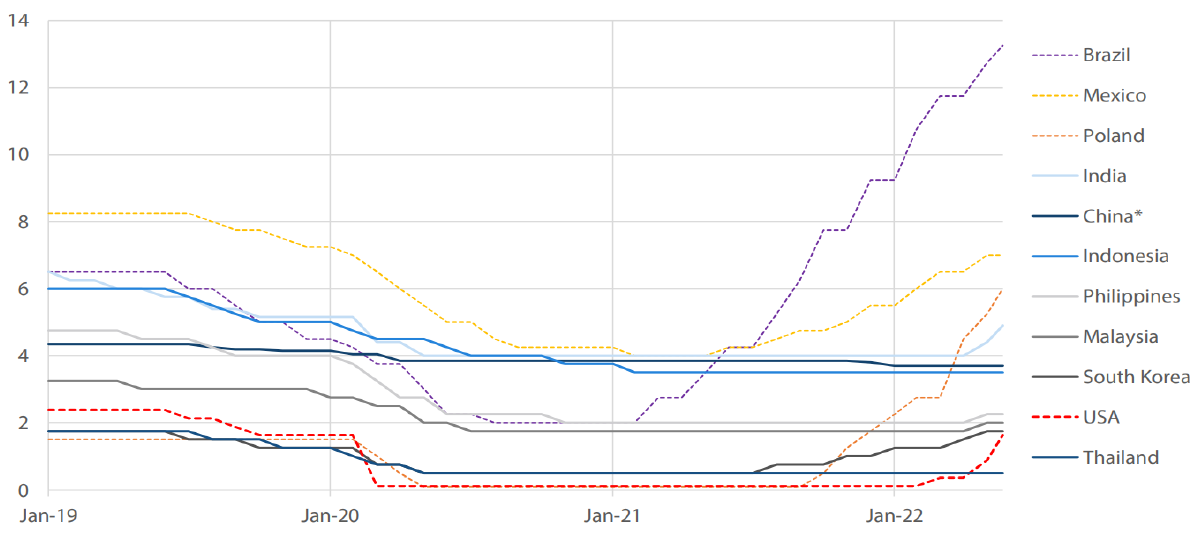
*China: 1yr MLF rate shown here as there is no official O/N policy rate
Source: Bloomberg as at June 2022
Asia offers real yields at relatively decent levels since inflation in the region is not as high. Chart 5 below shows the 10-year real yields of various countries, adjusted using core inflation (which strips out the volatile components). Indonesia, for example, offers more than 4% in real yield and countries like China, the Philippines, India and Malaysia offer more than 1% in real yield. In contrast, countries like the US, Germany, Poland and Chile offer negative real yields.
Chart 5: 10-year real yields as of end June 2022 and 5-year range (monthly)
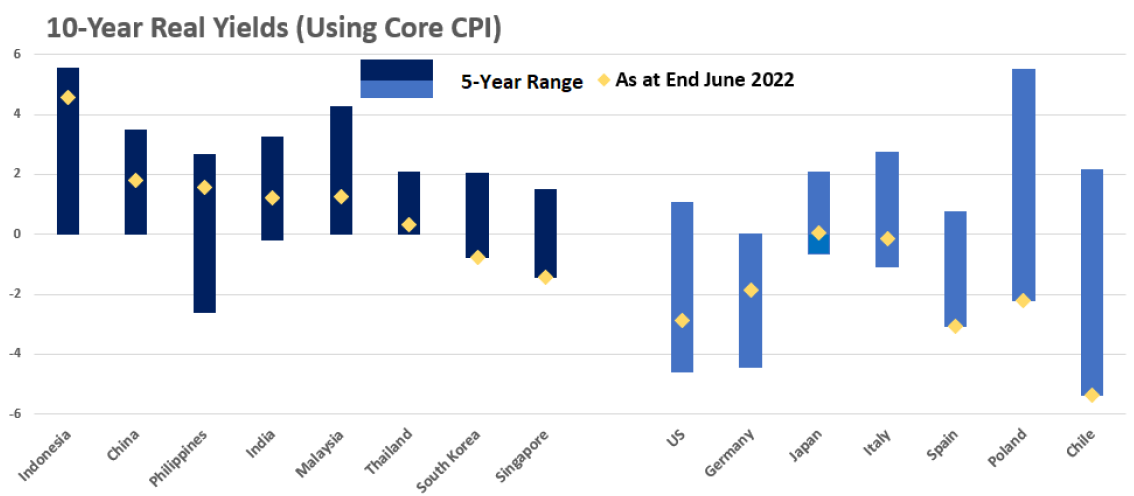
Note: The figures above are calculated by subtracting June Core CPI from 10-yr government bond yield on 30 June 2022.
Source: Bloomberg as at end-June 2022
Asia’s macro fundamentals are healthy
Asia is also in a favourable position from a macro fundamental perspective. Chart 6 shows that Asia government debt is more manageable compared to the rest of the world. Asian countries also boast strong FX reserves, measured in terms of months of imports. This means that Asian countries have large war chests to fall back on in case they need to support their currencies.
Chart 6: Asian macro fundamentals relative to other countries
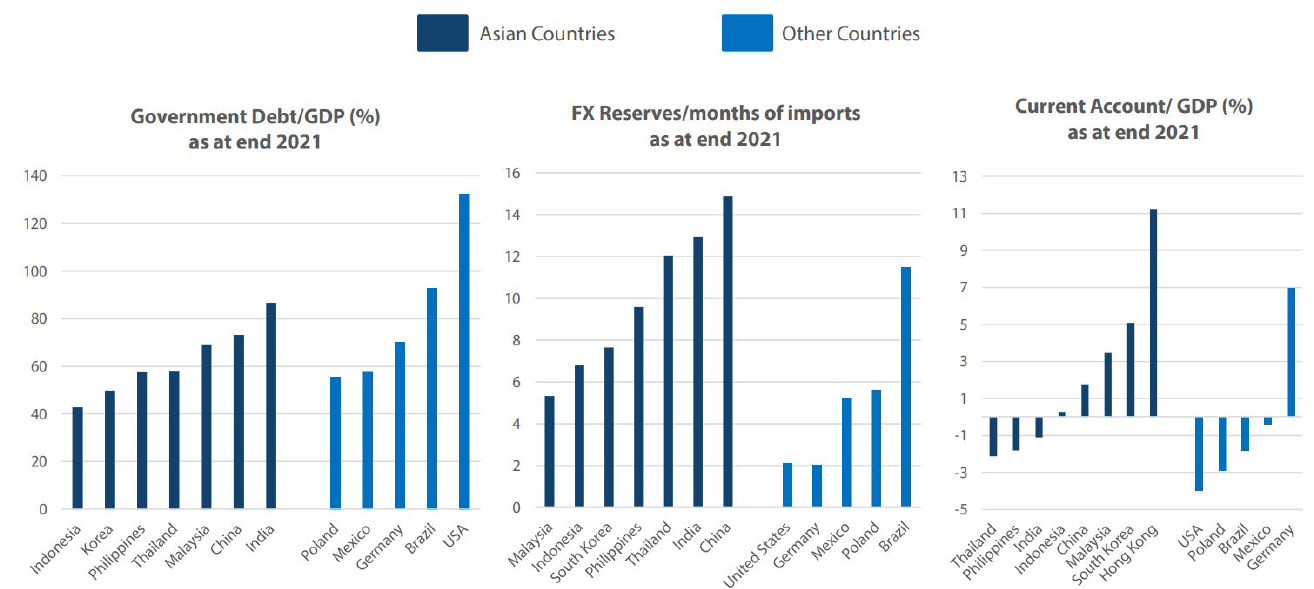
FX reserves in Thailand, India, China, US, Germany, Mexico, Poland are 2020 figures, and the rest are 2021 figures.
Source: World Bank, Bloomberg
Asia bonds have outperformed over the long term
Several factors support the outperformance by Asia bonds
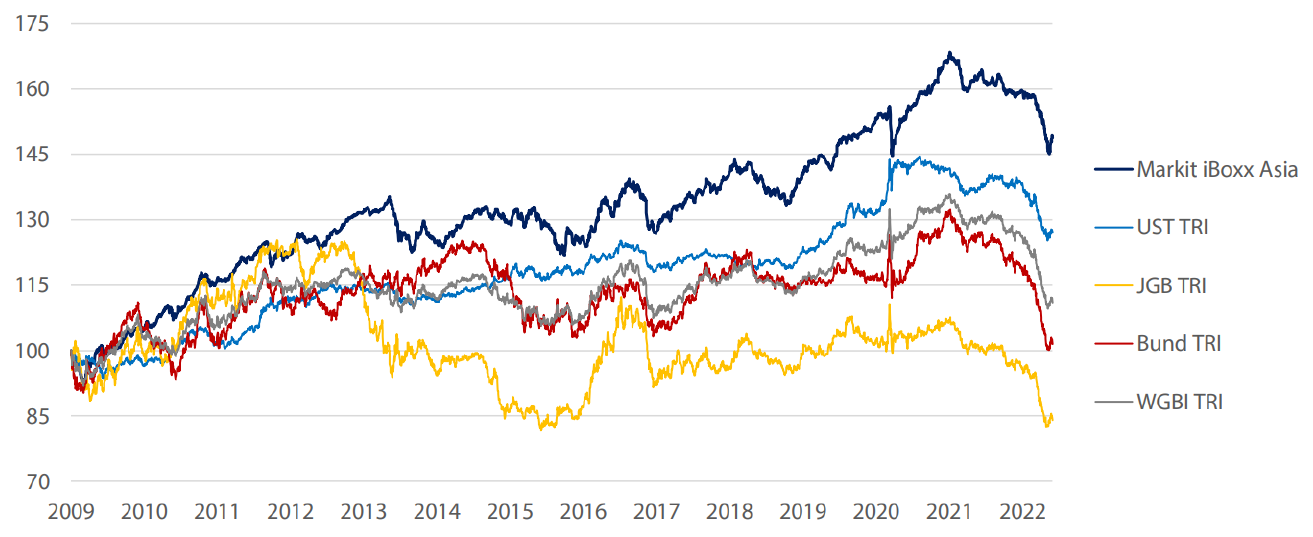
The long-term performance of various global bond indices is shown in Chart 7. Since 2009, Asian bonds have outperformed USTs, Japanese government bonds (JGBs), German bunds and the World Government Bond Index (WGBI). The outperformance by Asia bonds can be attributed to several factors. As mentioned above, Asia offers robust fundamentals which have continued improving. Their outperformance is also a reflection of growing confidence shown towards the assets by foreign investors. The attractive yields Asia offers relative to other parts of the world is another significant reason.
Chart 7: Daily returns of global bonds January 2009 to May 2022 (1 Jan 2009=100, returns in USD terms)
* Asia Local Bonds = Markit iBoxx Asia Index, US Treasuries = Bloomberg US Treasury Index
* WGBI = FTSE World Global Bond Index, Bunds = Bloomberg German Government All Bonds
* JGB = Nomura BPI JGB Total Index
Source: Bloomberg and Markit as at June 2022
Asia bonds can improve a portfolio’s Sharpe ratio, help investors diversify
By adding Asia bonds to a pure portfolio of USTs, JGBs, bunds and even global bonds (WGBI), the overall Sharpe ratio actually improves. For example, the Sharpe ratio of 0.28 for a pure US Treasury portfolio increases to 0.55 when Asia bonds are added (Chart 8).
Chart 8: 10 years to end-May 2022, daily returns, USD terms

Source: Bloomberg and Markit as at end-May 2022
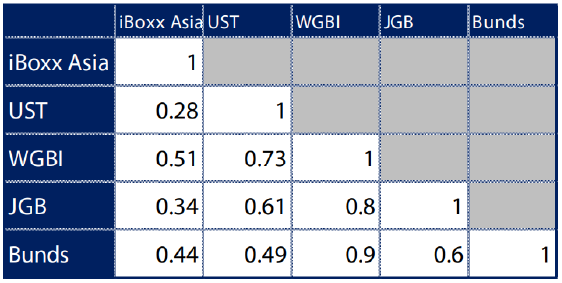
Asia bonds can also help investors looking to diversify their portfolios. The first column in Chart 9 shows the correlations between Asia bonds and their peers; Asia bonds have a relatively low correlation to other bonds and can therefore serve as a good asset class for diversification.
Chart 9: Correlations between Asia bonds and their peers
Source: Bloomberg and Markit as at end-May 2022
Closing comments
We believe that the market has priced in most of the Fed’s tightening; with UST yields facing less upward pressure in the second half of 2022 as inflation expectations appear to be stabilizing amid a less optimistic outlook for global growth. Oil is a key risk, although it is worth noting that we have started to see a correction in commodity prices. Barring further escalation of geopolitical tensions or oil price spikes, we see US dollar strength dissipating and lending support to Asian currencies. Most of the inflation we are seeing in Asia is supply-side driven, which is mainly related to food and energy prices with demand-side factors playing a relatively limited role. Within Asia, we see monetary normalisation starting to take divergent paths. This means there are opportunities in Asia for actively managed bond strategies; most importantly, we believe that Asian government bond yields are looking attractive after the recent market adjustments. In sum, we are now relatively more constructive in duration positioning across Asia local bond markets.


